


QS: Valuation Exercise - Bull Case

As I see QS’s ( QS 0.00%↑ ) future, today, there are really 3 primary scenarios that can play out.
Bear Case - QS fails to deliver a product that can be a scalable/working product.
Base Case - QS delivers a competitive product into a saturated market.
Bull Case - QS delivers a product that stands above all other cell manufacturers.
I’ll cover each of these cases with separate articles. Today, I’ll cover the Bull Case.
Bull Case Overview
The defining trait of the bull case is that Quantumscape is a “price maker” in the market:
Performance & Safety metrics are (at least) marginally better than competing batteries on the market (legacy or otherwise)
Production cost on a per-kwh basis is competitive
In essence, this projects to be the Land Grab scenario where Quantumscape can command a large market share with high profitability metrics.
Note, everything in this article assumes success for Quantumscape. This exercise shouldn’t be used, alone, to value Quantumscape. I will perform a global valuation later.
Royalty Revenue
Figure 1 is replicated from the Unit Economics article and represents the most reasonable bullish case for potential profitability. In the figure, “legacy” refers to current NMC li-ion cell costs (i.e., 21700). This number also assumes that NMC cells decline in price over the next handful of years. NMC cells currently cost close to $100 per kwh. So using the numbers in Figure 1 adds a layer of conservatism.

If Quantumscape’s technology allows for production cost savings due to their anode-free design (roughly 15% to 20% in manufacturing cost savings) and can hit their performance targets (allowing for premium mark-up on their cells), their peak profitability potential stands to reach close to $28 per kwh.
Naturally, since Quantumscape is going the licensing route and relying on partners to shoulder a lot of the manufacturing risk, I don’t believe they can command the full profitability potential.
Rather than guessing what the royalty compensation will be, I think it’s more prudent to view it as a range. See Figure 2.

Figure 2 highlights that the royalty payments could be anywhere in between 0$ and the maximum profitability limit of $27.70. It’s safe to assume that they’ll charge more than $0, and as mentioned, they probably won’t be able to capture the full $27.70 by going with licensing route.
In Figure 2, I’ve split the range into quartiles. The first and third quartile stand at $6.92 and $20.77, respectively (with the median being $13.85).
A couple of observations:
Even at the median royalty level ($13.85), PowerCo manufacturing costs are still at parity with Legacy Li-Ion costs (both around $73 per kwh - see Figure 1). PowerCo would essentially get the added performance for free.
The median ($13.85) would correspond very well with an assumption that the $130 million Royalty Prepayment covers the first 10 GWh of PowerCo production.
It’s also important to consider that the PowerCo deal may be unique in that part of the built-in compensation may be attributed to IP-sharing as defined in the licensing agreement. There’s no guarantee that the actual monetary compensation will be within the range provided in Figure 2. Again, this applies to the PowerCo agreement only.
Royalty Revenue = $6.92 - $20.77 per kwh
Market Share
This portion of the analysis requires a sort of “leap of faith” in terms of how much of the market Quantumscape can swallow. Between Europe and North America, the total annual production capacity is already expected to reach 2,500 GWh. The total possible addressable market for electric vehicles is in the 4,000 - 8,000 GWh range. So the planned capacity, under contract, is expected to reach roughly 40%, already. Where does Quantumscape fit in?
Either EVs will need further market penetration (beyond the 40% of all vehicles) or Quantumscape will need to offer a strong enough value proposition for factories to retrofit towards the QS platform.
On the former, it’s likely that QS’s technology opens up new markets for battery technology: trucks requiring towing capacity, cold weather locales, performance vehicles, etc.
For legacy facility retrofits, we can actually run that cost benefit analysis once we get more data. We know that 40% of the legacy equipment can be retained for use with QS manufacturing lines. We also know that anode production processes are removed, completely. All we would need to do is compare the value gained (i.e. profit improvement for the manufacturer) by upgrading to the Quantumscape technology stack against the cost of the retrofit. If that yields positive value, then upgrading is a no-brainer. Otherwise, QS would require some sort of attrition (facilities phased out due to age or ones requiring major capex maintenance) before they can actually steal currently existing capacity.
Both of these are certainly possible, but it’s not as straight of a line to get to TWh scale as if they had reached commercialization on their original timeline - prior to ground breaking on all these domestic factories. What this does mean is that adding capacity will probably happen at a much slower rate.
Still, this is the bull case, so we’ll carry on.
A reasonable long-run / steady-state baseline assumption is that QS can capture roughly 25% of the domestic and international markets (as defined in my Addressable Market post). This would amount to a median estimate of 1,500 GWh.
Long Run Market Share: 25%
Long Run Production Capacity: 1,500 GWh
Considerations
As a litmus test, we can compare market capture against other industries. Nvidia, for example, currently commands nearly 90% of the GPU market, and nearly 50% of the CPU + GPU market (in terms of revenue).
I think this is a decent corollary because not every EV will require a lithium metal battery pack just like not every computer needs a high performance GPU.
25% market share for Quantumscape is just a random guess, but I think it’s optimistic enough to be the Bull Case condition while also not being too outlandish. Is there a world where Quantumscape captures >50% of the market? Yes, but it’s also probably a too “pie in the sky” forecast to make at this juncture.
Production Timing
In regards to the ramp rate for the PowerCo licensing deal, we need to make some assumptions:
Giga Scale design is on-going (as of 2025)
PowerCo will first build out a 1 GWh Pilot Line, and validate performance, before horizontally scaling.
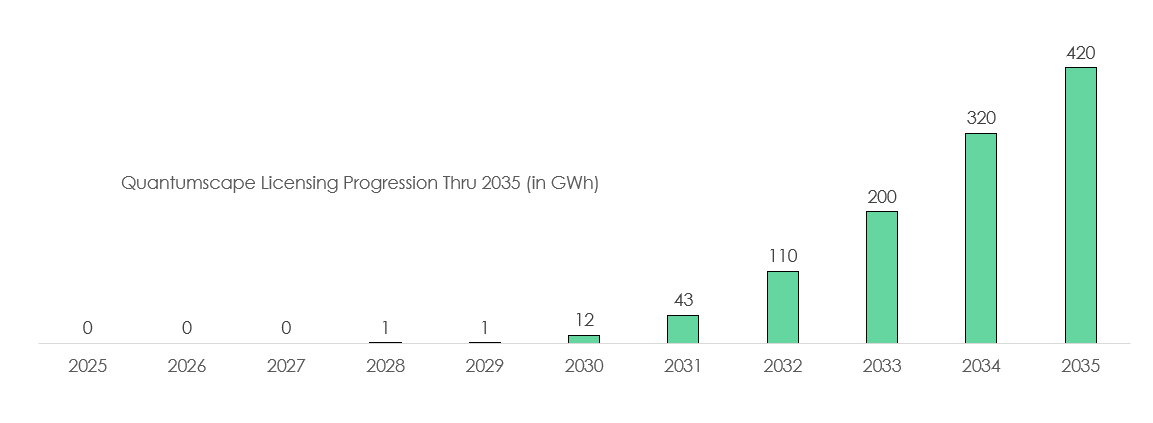
Using these assumption as a baseline, I’ve come up with the following ramp schedule (Figure 3).

This feels like a conservative, but very realistic production outlook. Tesla took 4 years from announcement to surpassing 10 GWh at their first Giga Factory in Nevada. My projection for PowerCo is slightly longer at 5 years. I think this is reasonable, but I also wouldn’t be surprised if the true timeline is off by 18 months in either direction.
If we assume the other OEMs follow the same timeline, and are staggered slightly (OEM2 & OEM3 start pilot production a year later than PowerCo - OEM4 & OEM5 start a year after that), the path to 2035 looks as follows:
From here, I’m just going to assume that 100 GWh of annual capacity is added every year until the they reach the 1,500 GWh target in 2045.
Discounted Cash Flow Analysis
Figure 5 offers a rough-shod attempt at a DCF. The analysis presented uses the following assumptions:
80% Gross Profit Margins used in-line with Capital Light business model.
Operating expenses (largely driven by R&D and SG&A) are set to grow 8% per year until sustained profitability is reached. After which Opex is set to 25% of revenue. This is similar to other capital light businesses.
The median royalty revenue rate (Figure 2) of $13.85 for illustration purposes. Figure 6 will show the full fair value range.


Liquidity
Quantumscape states that their liquidity runway should last until the second half of 2028. My numbers also bear that out. Annual cash burn can be estimated from the “Net Profit” column in Figure 5, adding back in stock based compensation (roughly $150 million per year) and depreciation ($70 million a year) as these are both non-cash expenses.
If you make this adjustment to all the negative values in the net profit column (thru 2031), the total cash needed to reach profitability will be around $2.6 billion. Quantumscape currently has just under $1 billion. Adding in the royalty pre-pay, they should have close to $1.13 billion in liquidity. QS will need to raise future capital (whether through more licensing deals involving prepays, dilution, or debt financing).
It’s worth noting that my opex estimate is likely over-conservative. QS has already paired back their cash burn for 2025 as defined as ‘adjusted EBITDA’ in the shareholder letter (citing reduction in manpower). My estimate may be overstating cash burn by as much as 30%, which would bring down the $2.6 billion figure (cited in the paragraph above) closer to $1.8 billion. This would be much more manageable.
Long Run Cash Pile
You’ll notice in Figure 5 that the Retained Earnings metric really starts to balloon after 2036. This will correspond with cash piling up on the balance sheet which could be used for distributions to shareholders (through buybacks and dividends) or for expansion (accelerating capacity and pulling future cash flows forward).
In addition 2033 looks to be the time-period where Quantumscape will be able to afford to start building out their own production facilities.
Is This My Fair Value Estimate For The Stock?
No.
This would be the fair value estimate for the stock if we knew for certain that all conditions in the Bull Case Overview would be met.
Figure 7 illustrates how the Bull Case valuation differs from the risk adjusted valuation. In order for the risk-adjusted valuation to converge with the bull case, we need to see risk-off events (until there’s no risk left). These events could include passing B sample phase, successful demonstration, launch vehicle commercialization, PowerCo pilot line installation, etc. Realistically, we should have already experienced this effect with A sample delivery, QSE-5 announcement, B0 sample delivery, licensing agreement. But alas, we’ve had no such luck in terms of price movement.
That said, the valuation likely has changed. I can say, with a high degree of certainty, that QS’s path to commercialization is less risky today than it was in 2021 prior to multi-layer cell development.

If we’re looking for margin of safety, we need to compare the stock price against the risk-adjusted valuation.
I will cover the risk-adjusted valuation in a “global” valuation post at a later date.
Discount Rate
In my analysis, I used an 8% cost of equity rate - inline with the current market risk premium. You may be asking why I’m not using a higher discount rate such as 25% typically used for early-stage / pre-revenue start-ups or a CAPM measure which would be in the same range.
I plan on using an expected value method later to determine the ‘probability weighted’ intrinsic value to account for execution risk (or the risk of the bull case condition not playing out). Using a high discount rate here (to account for higher risk) and then adding knock-down factors later to account for the high risk of failure would be double counting risk components, making the final valuation analysis too conservative.
Going the ‘expected value’ route allows us to be more granular in the potential scenarios that may play out.
Just for fun, if we did use a 25% discount rate and the median royalty payment ($13.85 per kwh), we would get a fair value of $18 per share.
Implied Probability Of Success
If the only two outcomes were the bull case (with a median projected fair value of $94) and bankruptcy (with a payout of $0), we can find the market’s implied probability of success for this case as defined by the expected value equation below:
At today’s price of $4.50 (ish), the implied probability would be under 5%. In other words, the market is pricing in a 95% chance that this scenario doesn’t play out. That may be correct, but it also doesn’t account for the fact that there’s other scenarios in between that don’t end in zero.
Right Tails
As aggressive as this estimate is, it still doesn’t even capture the full right tail potential.
25% market share (total developed-world car market) is a bold assumption, but that number could bear out to be even higher.
This analysis doesn’t consider other markets that QS technology may be suitable for. Trucking, aviation, and consumer electronics could be high volume, high margin markets. Stationary storage is another market they could eventually break into.
Terminal Value
The terminal value of the DCF accounts for 66% of the total valuation. Changes to the long run earnings potential (i.e., errors in margin expectations, demand capacity estimates, or royalty pricing) will affect the valuation, tremendously.
Conclusion
This should be considered a rough draft and definitely isn’t a polished valuation. That said, I think this can serve as a decent framework to iterate off of. As we receive more clarity on royalty pricing, production timelines, and OEM deals, we can quickly adjust our numbers here.
Just to quickly summarize my current assumptions:
Royalty pricing is expected to be between $6 and $20 per kwh
1,500 GWh of annual demand (in the long run).
Ramp will be very slow until about 2032. After which, annual capacity is expected to increase by about 100 GWh per year. The full 1,500 GWh production rate won’t be achieved until 2045.
High margin characteristics associated with capital light business model: 80% gross profit margin & 45% net profit margin. These numbers may change in the event that QS becomes a producer, themselves, but the absolute profitability numbers (in dollars) shouldn’t move much.
Bull Case fair value between $42 & $144 (wide range due to unknown royalty pricing)
This is not to be used as the fair value estimate for the stock. A ‘global’ valuation analysis will be needed to account for execution risk.
Expect dilutions to continue
I've cross posted this article to reddit at the following link:
https://www.reddit.com/r/QUANTUMSCAPE_Stock/comments/1j4by8d/valuation_exercise_bull_case/
Feel free to join the discussion there, or add commentary to the comments section, here. I'd love any and all feedback. Thanks!