

QS: Valuation Exercise - Base Case

As I see QS’s future ( QS 0.00%↑ ) , today, there are really 3 primary scenarios that can play out.
Bear Case - QS fails to deliver a product that can be a scalable/working product.
Base Case - QS delivers a competitive product into a saturated market.
Bull Case - QS delivers a product that stands above all other cell manufacturers.
I’ll cover each of these cases with separate articles. Today, I’ll cover the Base Case.
Base Case Overview
The defining trait of the base case is that Quantumscape is a “price taker” in the market:
Performance & Safety metrics roughly match competing batteries on the market (legacy or otherwise)
Market is saturated with many competitors
In this scenario, Quantumscape captures a small market share with only reasonable margins.
Note, everything in this article assumes a single outcome for Quantumscape. This exercise shouldn’t be used, alone, to value Quantumscape. I will perform a global valuation later.
Royalty Revenue
Figure 1 is based on the cost structure described in the Unit Economics article, but updated to represent the a more subdued profitability outcome. In the figure, “legacy” refers to current NMC li-ion cell costs (i.e., 21700). This number also assumes that NMC cells decline in price over the next handful of years. NMC cells currently cost close to $100 per kwh. So using the numbers in Figure 1 adds a layer of conservatism.
The defining characteristic of the base case is that Quantumscape, being in a competitive market, would no longer command any premium for their product. In addition, I’m also going to factor in the potential that being unable to reach economies of scale results in slightly higher production costs (in comparison to the bull case).
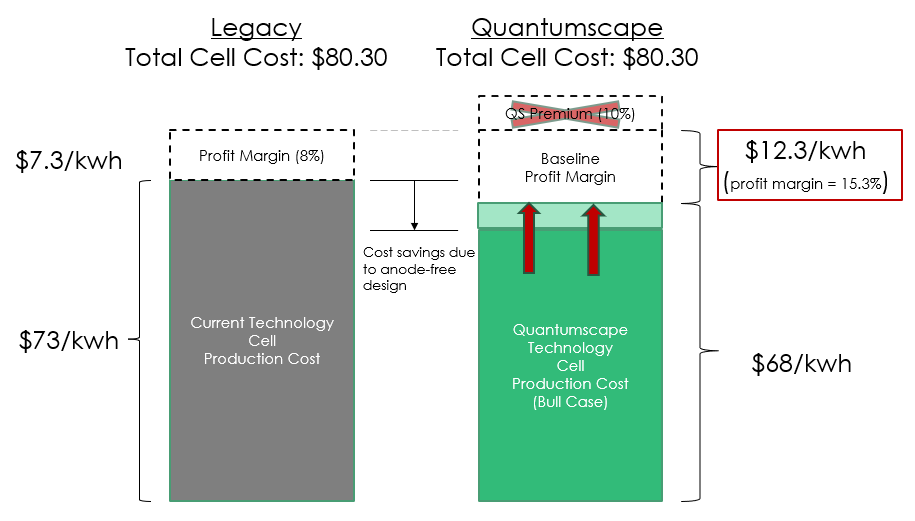
Similar to the bull case, since Quantumscape is going the licensing route and relying on partners to shoulder a lot of the manufacturing risk, I don’t believe they can command the full profitability potential.
Rather than guessing what the royalty compensation will be, I think it’s more prudent to view it as a range. See Figure 2.
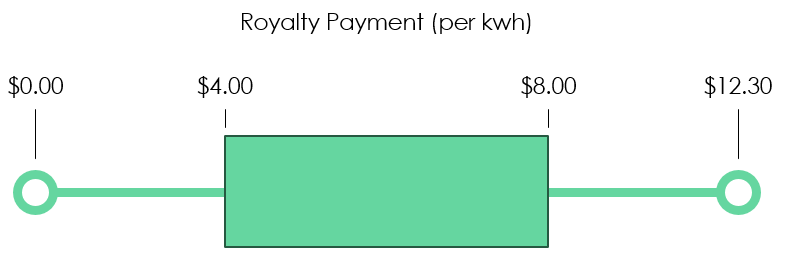
Figure 2 highlights that the royalty payments could be anywhere in between 0$ and the maximum profitability limit of $12.30. I’ve assumed that the royalty capture in this scenario is between $4 and $8 (median of $6).
Note that initial licensing deals may not be in this range, and could be much higher. I imagine licensing revenue would settle into this range only after the market reaches a saturation point.
Royalty Revenue = $4 - $8 per kwh
Production Schedule
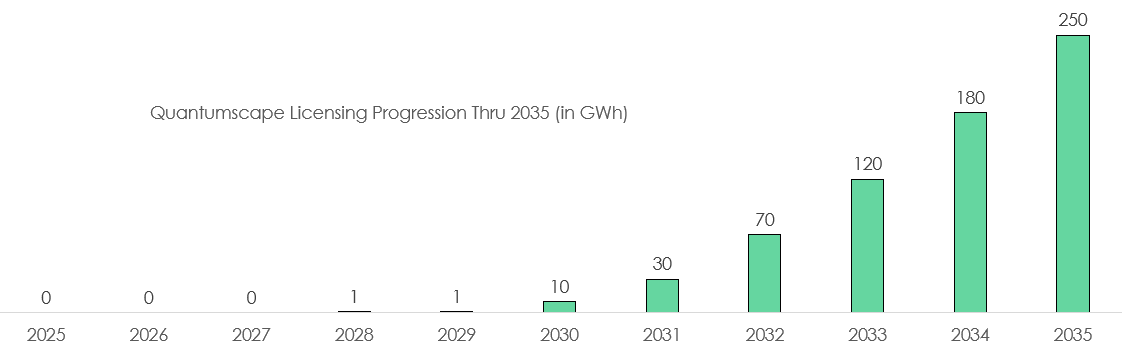
For the ramp schedule, I’m going to use similar starting numbers and timeline as the Bull Case, but a much slower ramp schedule. I will also assume fewer OEMs sign with Quantumscape over the long run.
The overall assumptions lead to a 4% market share (250 GWh) by 2035, and then a slow ramp to 500 GWh by 2045. This is less than half of the assumed market share from the Bull Case, and is in line with being in a more competitive market.
Discounted Cash Flow Analysis
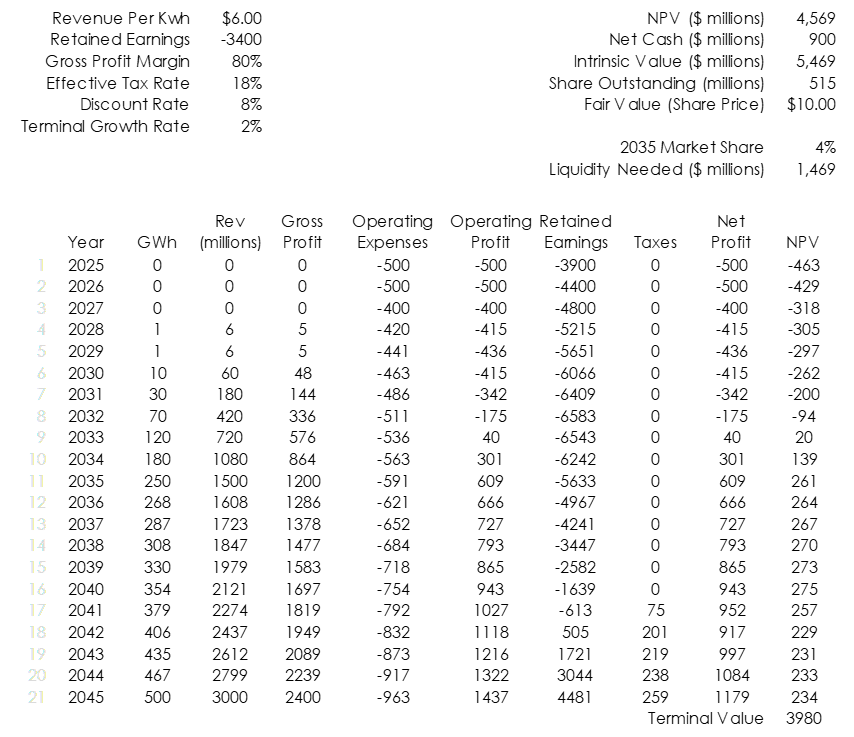
The analysis presented in Figure 4 uses the following assumptions:
80% Gross Profit Margins used in-line with Capital Light business model.
Operating expenses (largely driven by R&D and SG&A) are assumed to dip in the next two years as a means to stay lean; Quantumscape leaning heavily into the capital light business model.
The median royalty revenue rate (Figure 2) of $6.00 for illustration purposes. Figure 5 will show the full fair value range.
Opex
Consider the following conditions:
Royalty Rate = $4 per kwh
Ramp Schedule in Figures 3 & 4 are correct
QS doesn’t pull back on Opex spending
If all of these conditions are met, the eventual cash flows can’t overcome today’s expenses on a net present value basis, and an investment in QS would be worth $0 today.
I assumed a drop in Opex over the next couple of years to compensate. I don’t know if this is a good assumption. If Quantumscape enters a saturated market, it may be likely that they’ll want to increase spending in an attempt to differentiate. This “spending spiral” would be detrimental to investors holding today.
Conclusion
This should be considered a rough draft and definitely isn’t a polished valuation. That said, I think this can serve as a decent framework to iterate off of. As we receive more clarity on royalty pricing, production timelines, and OEM deals, we can quickly adjust our numbers here.
Just like the the Bull Case, this analysis, alone, isn’t to be taken as a fair value estimate for Quantumscape.
Just to quickly summarize my current assumptions:
Royalty pricing is expected to be between $4 and $8 per kwh
250 GWh of annual demand by 2035. 500 GWh of annual demand by 2045.
High margin characteristics associated with capital light business model: 80% gross profit margin & 40% net profit margin. These numbers may change in the event that QS becomes a producer, themselves, but the absolute profitability numbers (in dollars) shouldn’t move much.
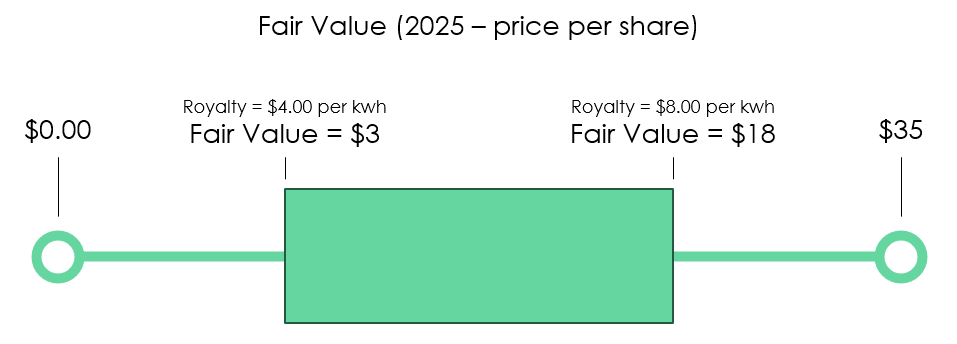
Base Case fair value between $3 & $18 (wide range due to unknown royalty pricing). Median fair value estimate is $10 per share.
This is not to be used as the fair value estimate for the stock. A ‘global’ valuation analysis will be needed to account for execution risk.