

Is Verizon a Buy?

The more I look at Verizon and some of these other telecom names, the more I see Buffett’s railroad bet back in the early 2010s. These are capital intensive, unsexy businesses that spit out a ton of cash. They are the legacy fixed infrastructure plays of the modern era. Where trains moved goods, telecoms move data.
This one doesn’t require a 50-page thesis and I’m not going to go into the unit economics of cell tower operations…the business case has largely been proven out. But I will cover my thoughts on how to value this company as well as some risks that could bust the thesis.
Valuation Notes
Here are some basic valuation stats:
PE ratio (TTM): 10.5
PE ratio (NTM): 8.6
Dividend Yield: 6.7%
Dividend Payout Ratio: 67%
Revenue: Stable
Net Margins: Stable1
Debt-to-Equity: 196%
Interest Coverage Ratio: 4.6x
1 2023 had a special capital asset write-off that hurt earnings, but other than that, revenue and earnings have been pretty steady.
We’ll get into cash flows and valuation in a minute, but at a high level, the business seems pretty solid. It’s funny what gets monikered with the quality label these days. Typically, “quality” is only reserved for companies that are already trading at 50x multiples. I won’t say that Verizon is the highest quality company - the debt to equity ratios are pretty meteoric, and they actually have negative tangible book value, but the earnings power has been robust and the debt is clearly manageable for a company this stable.
I’d love to see the debt levels come down, but this company checks a lot of boxes from a valuation perspective.
Capital Allocation ‘Hierarchy’
Management has remained pretty steadfast on these priorities (in this order).
1. Investment in the Business
Management has stated that their number one priority is investing in the business with the goal of delighting their customers and taking care of their employees and stakeholders. I think it’s admirable…if they truly mean it.
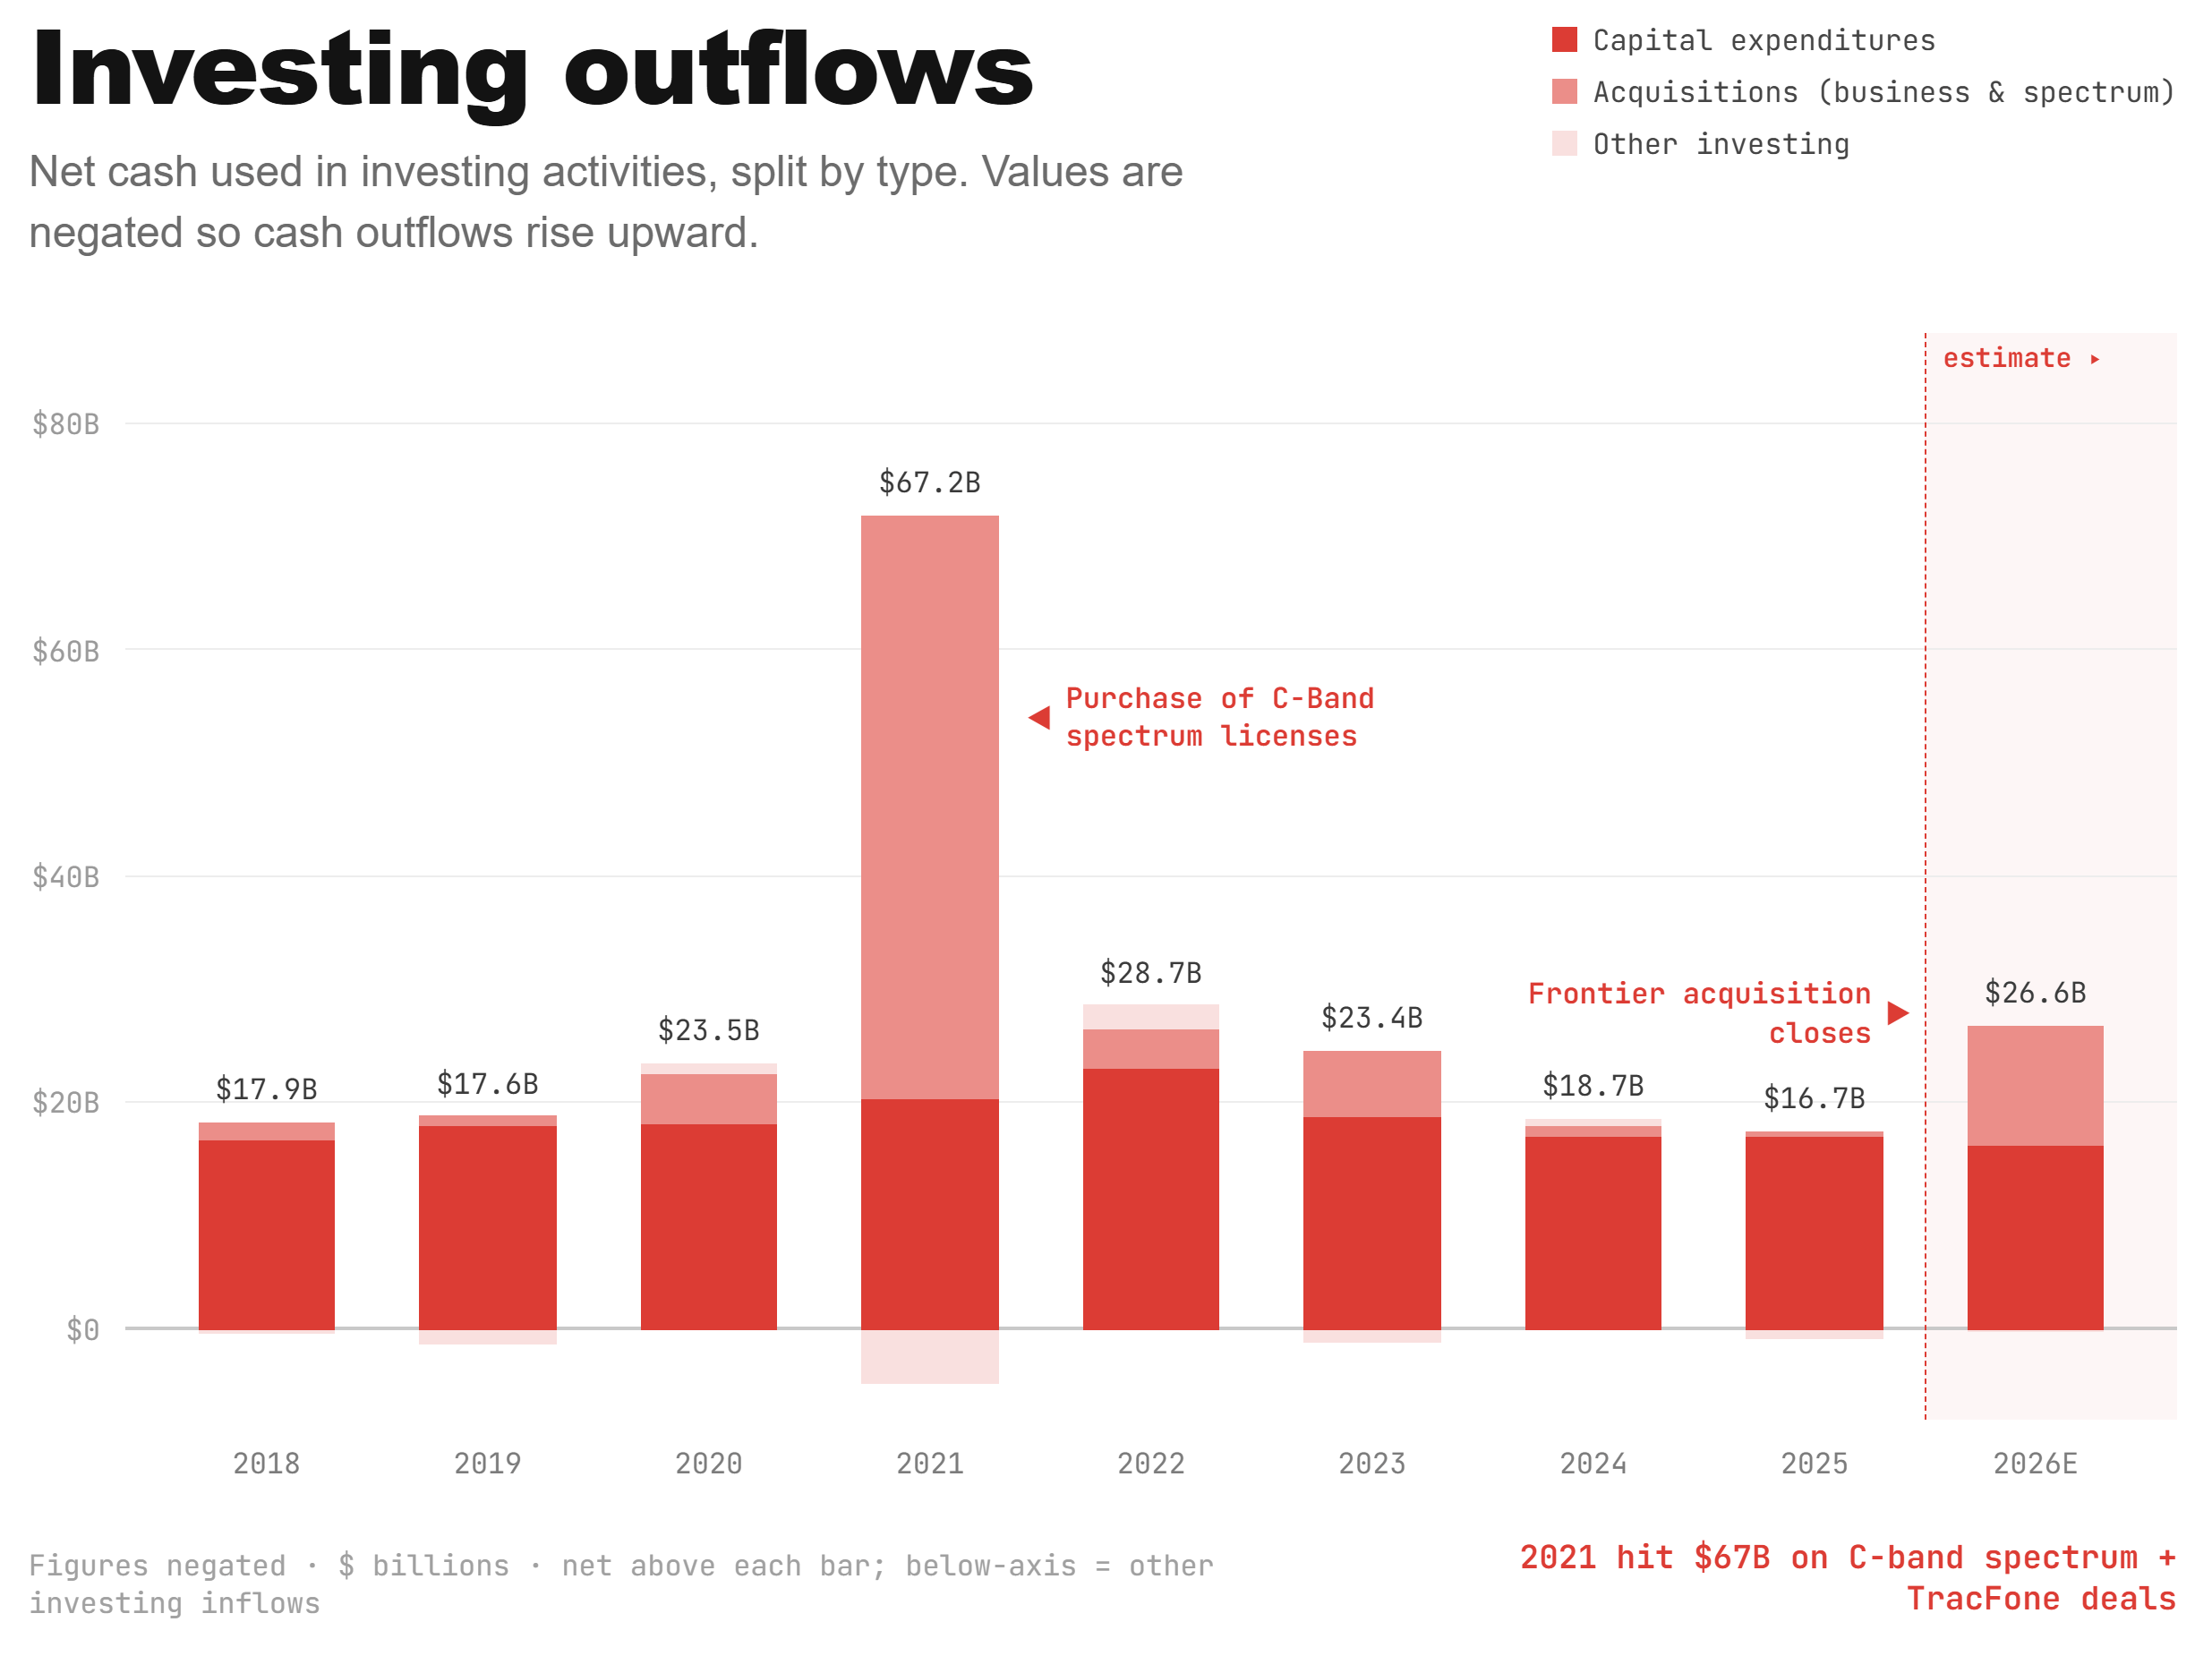
When they’re not making big-chunk acquisitions, baseline capex has been in the 16-18 billion dollar range. Notably, the 2026 capex estimate (excluding the Frontier purchase) is in the lower end of that range.
2. Commitment to the Dividend
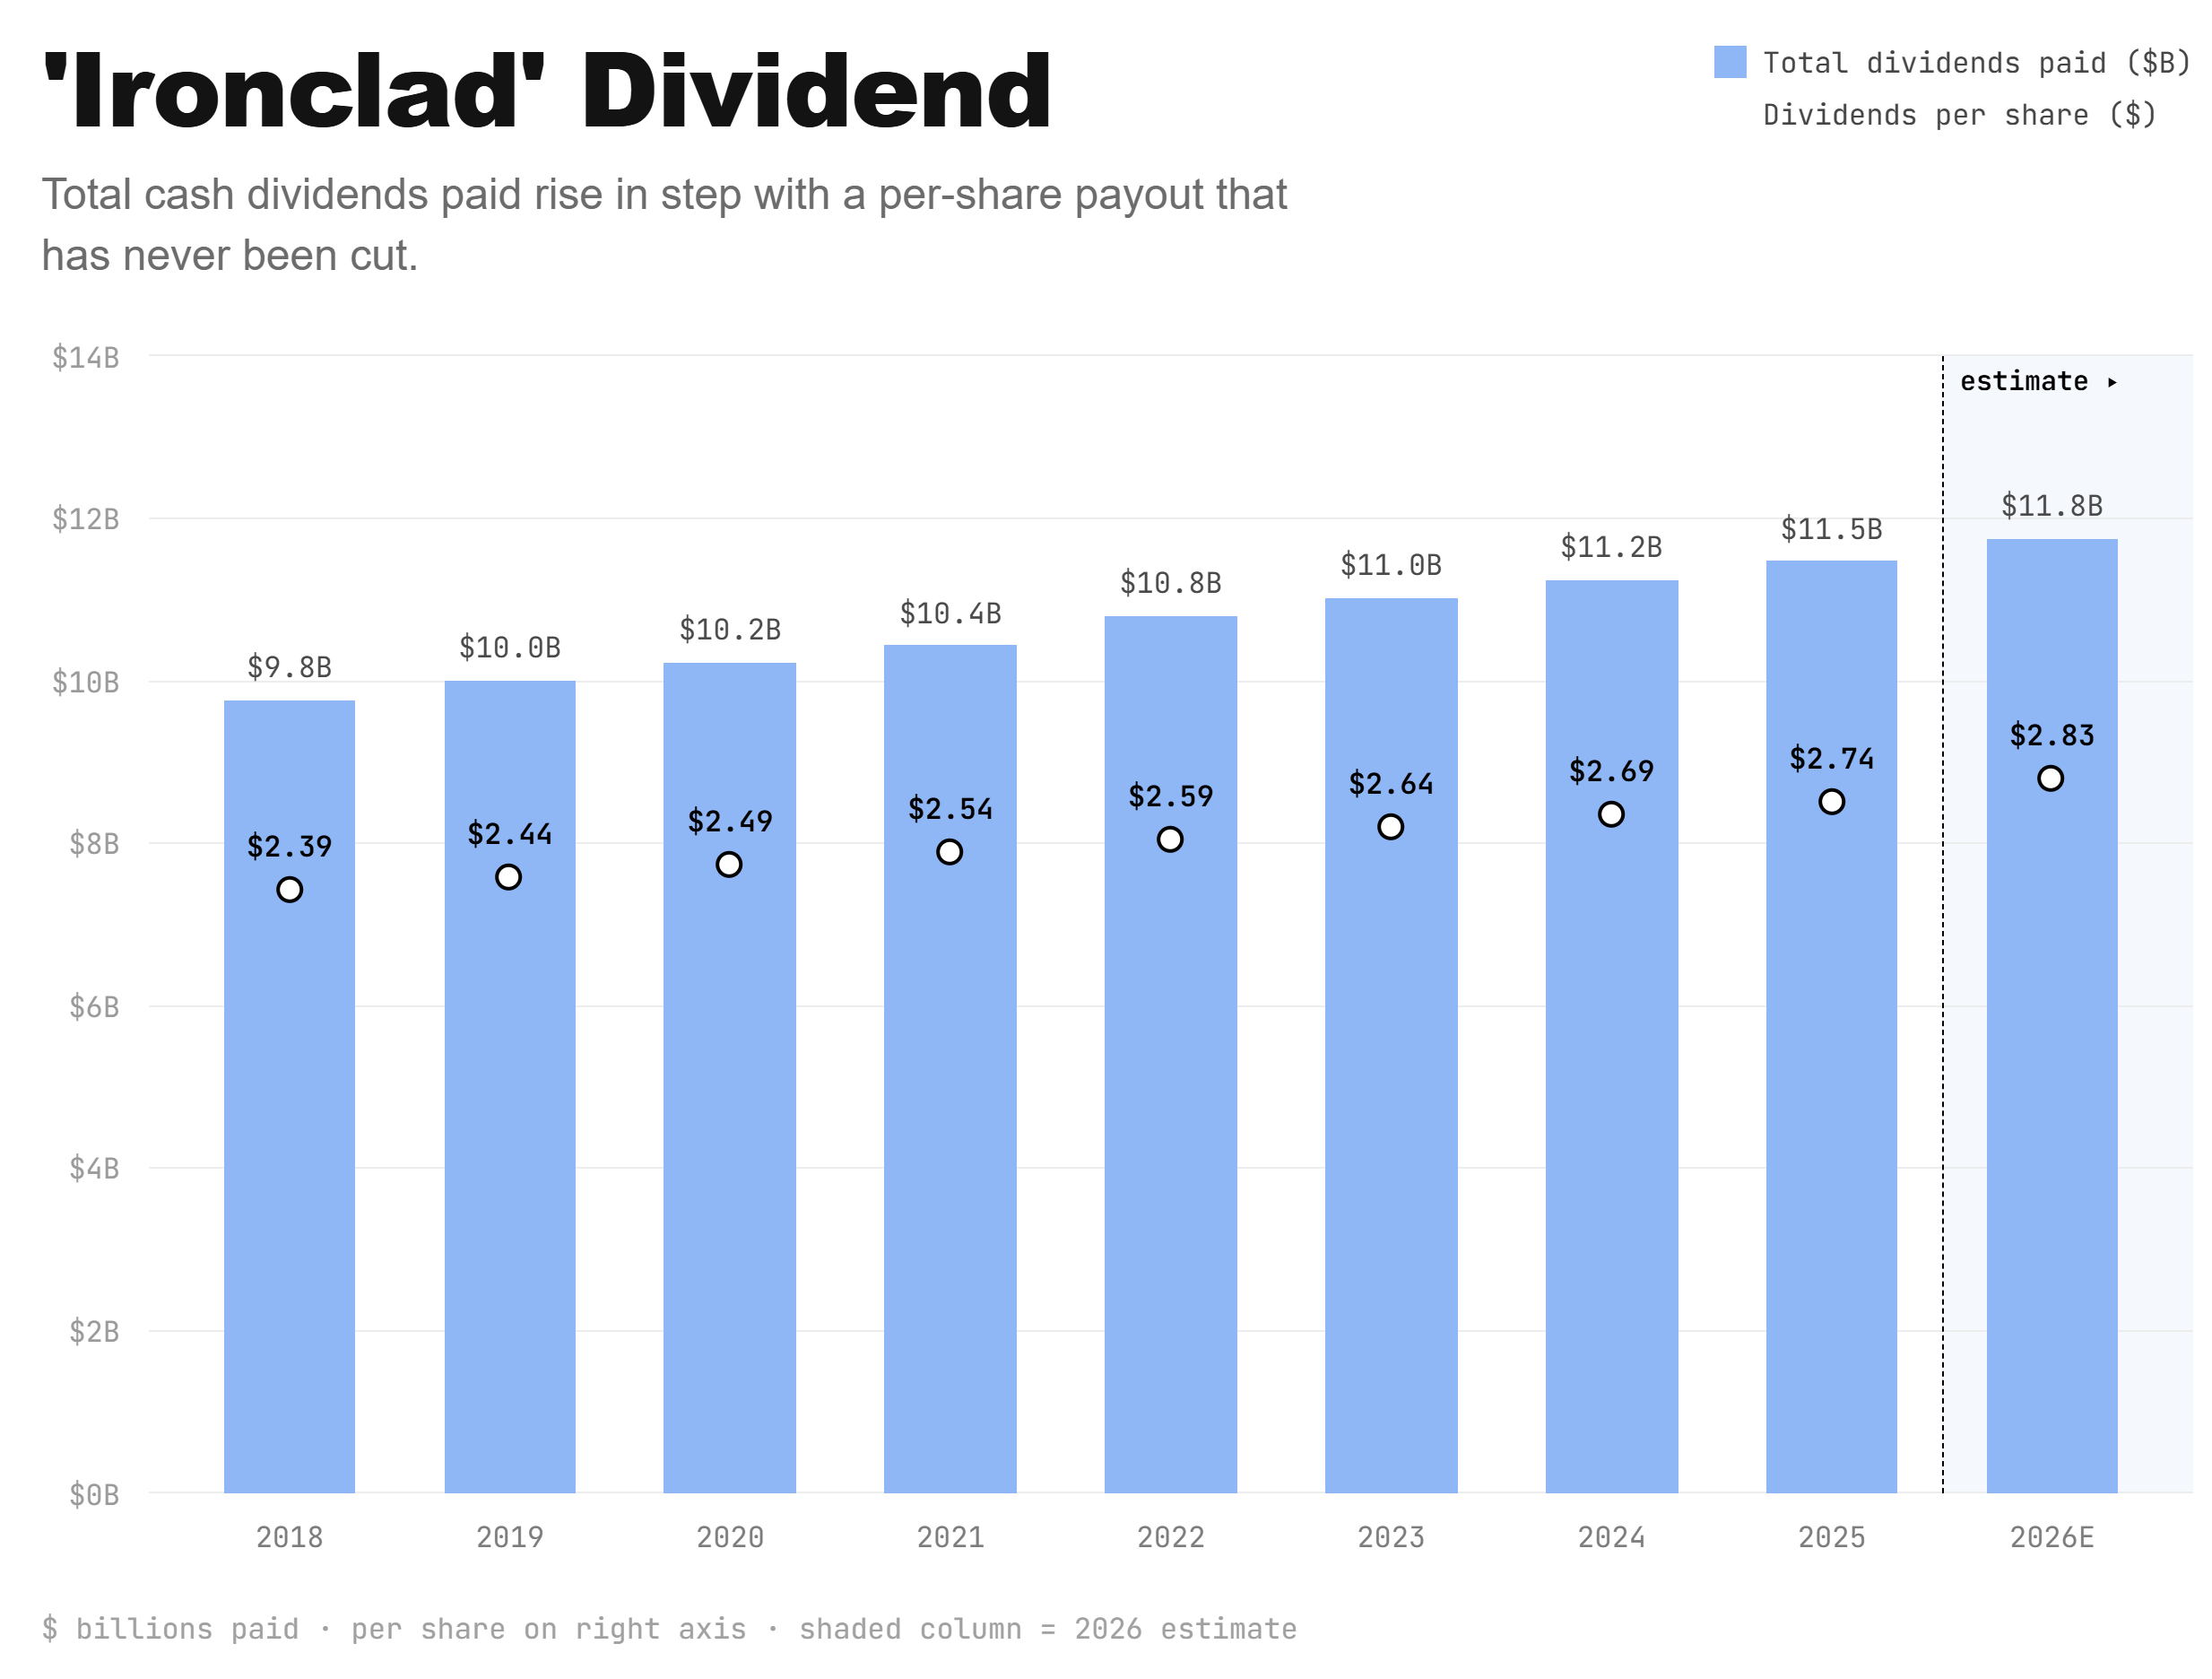
Management has described their commitment to the dividend as ‘ironclad’.
Verizon is actually the perfect candidate for performing a Dividend Discount Model (DDM). So this is a particularly important chart.
3. Deleveraging
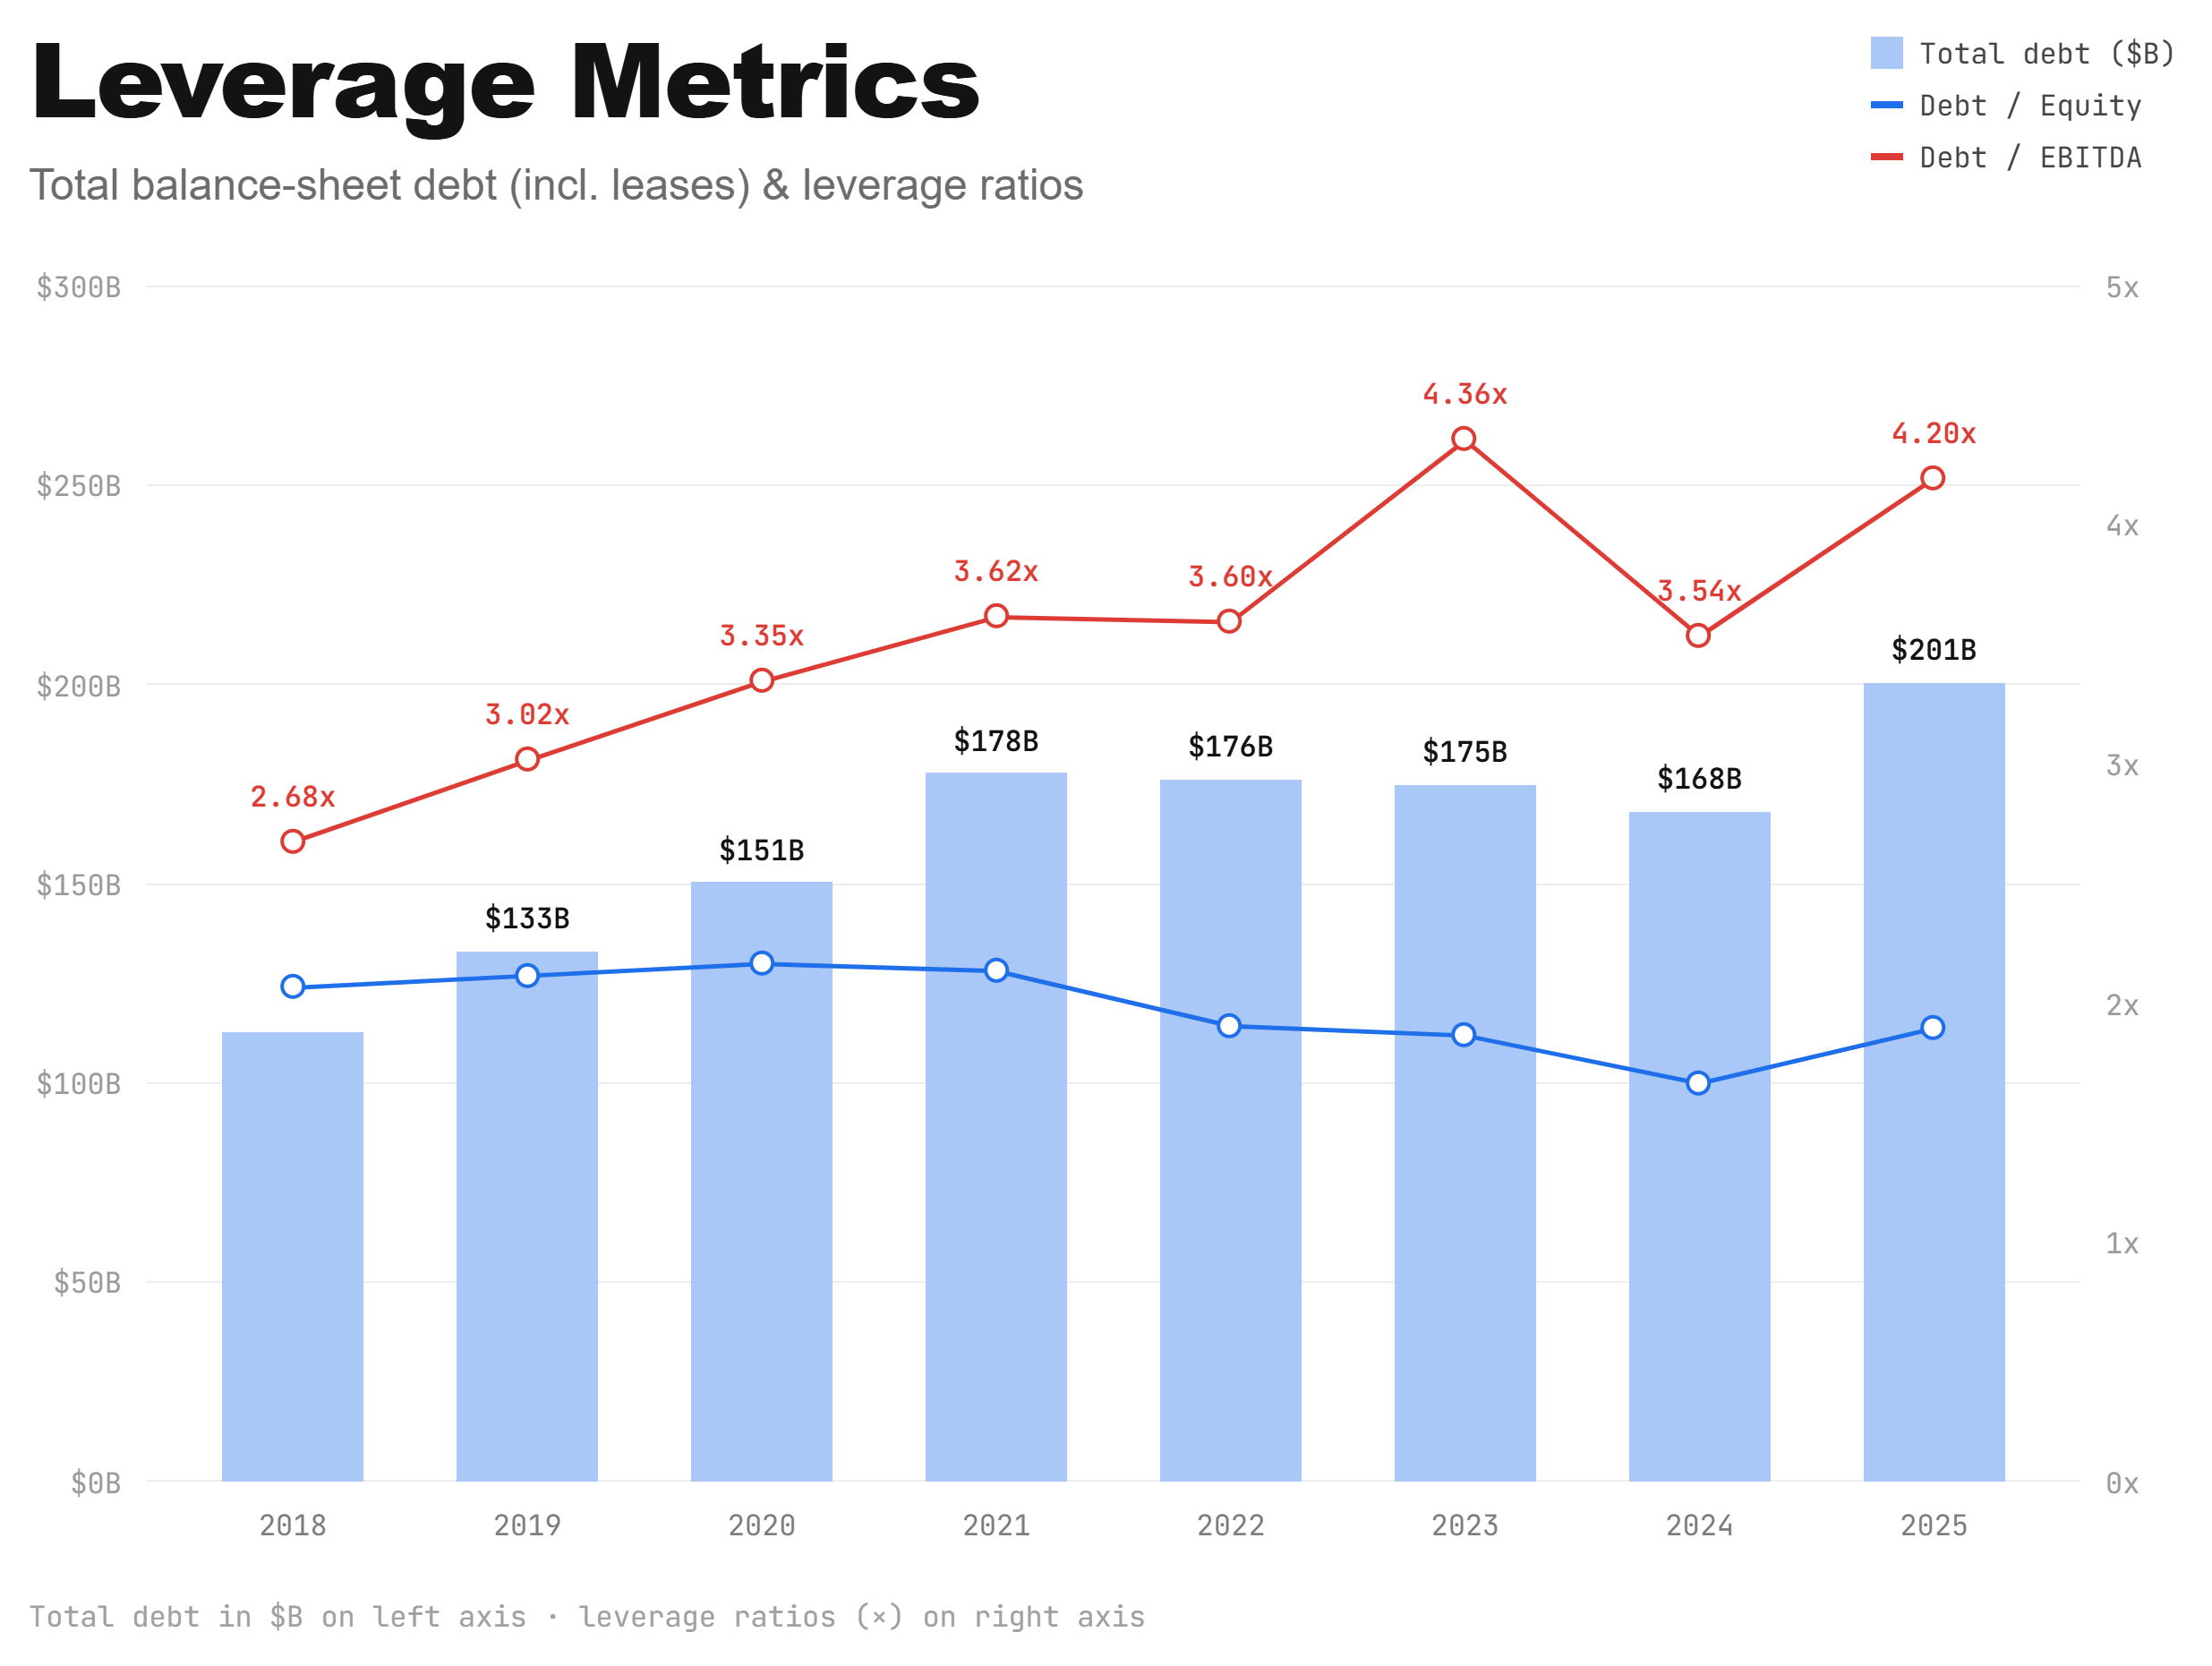
Verizon’s debt levels first jumped post-Covid in order to fund their C-Band spectrum license acquisition. Since 2022, they’ve clearly worked to level off and start paying some of that down. But just as they started making headway, they found the Frontier acquisition to erase all that progress and then some.
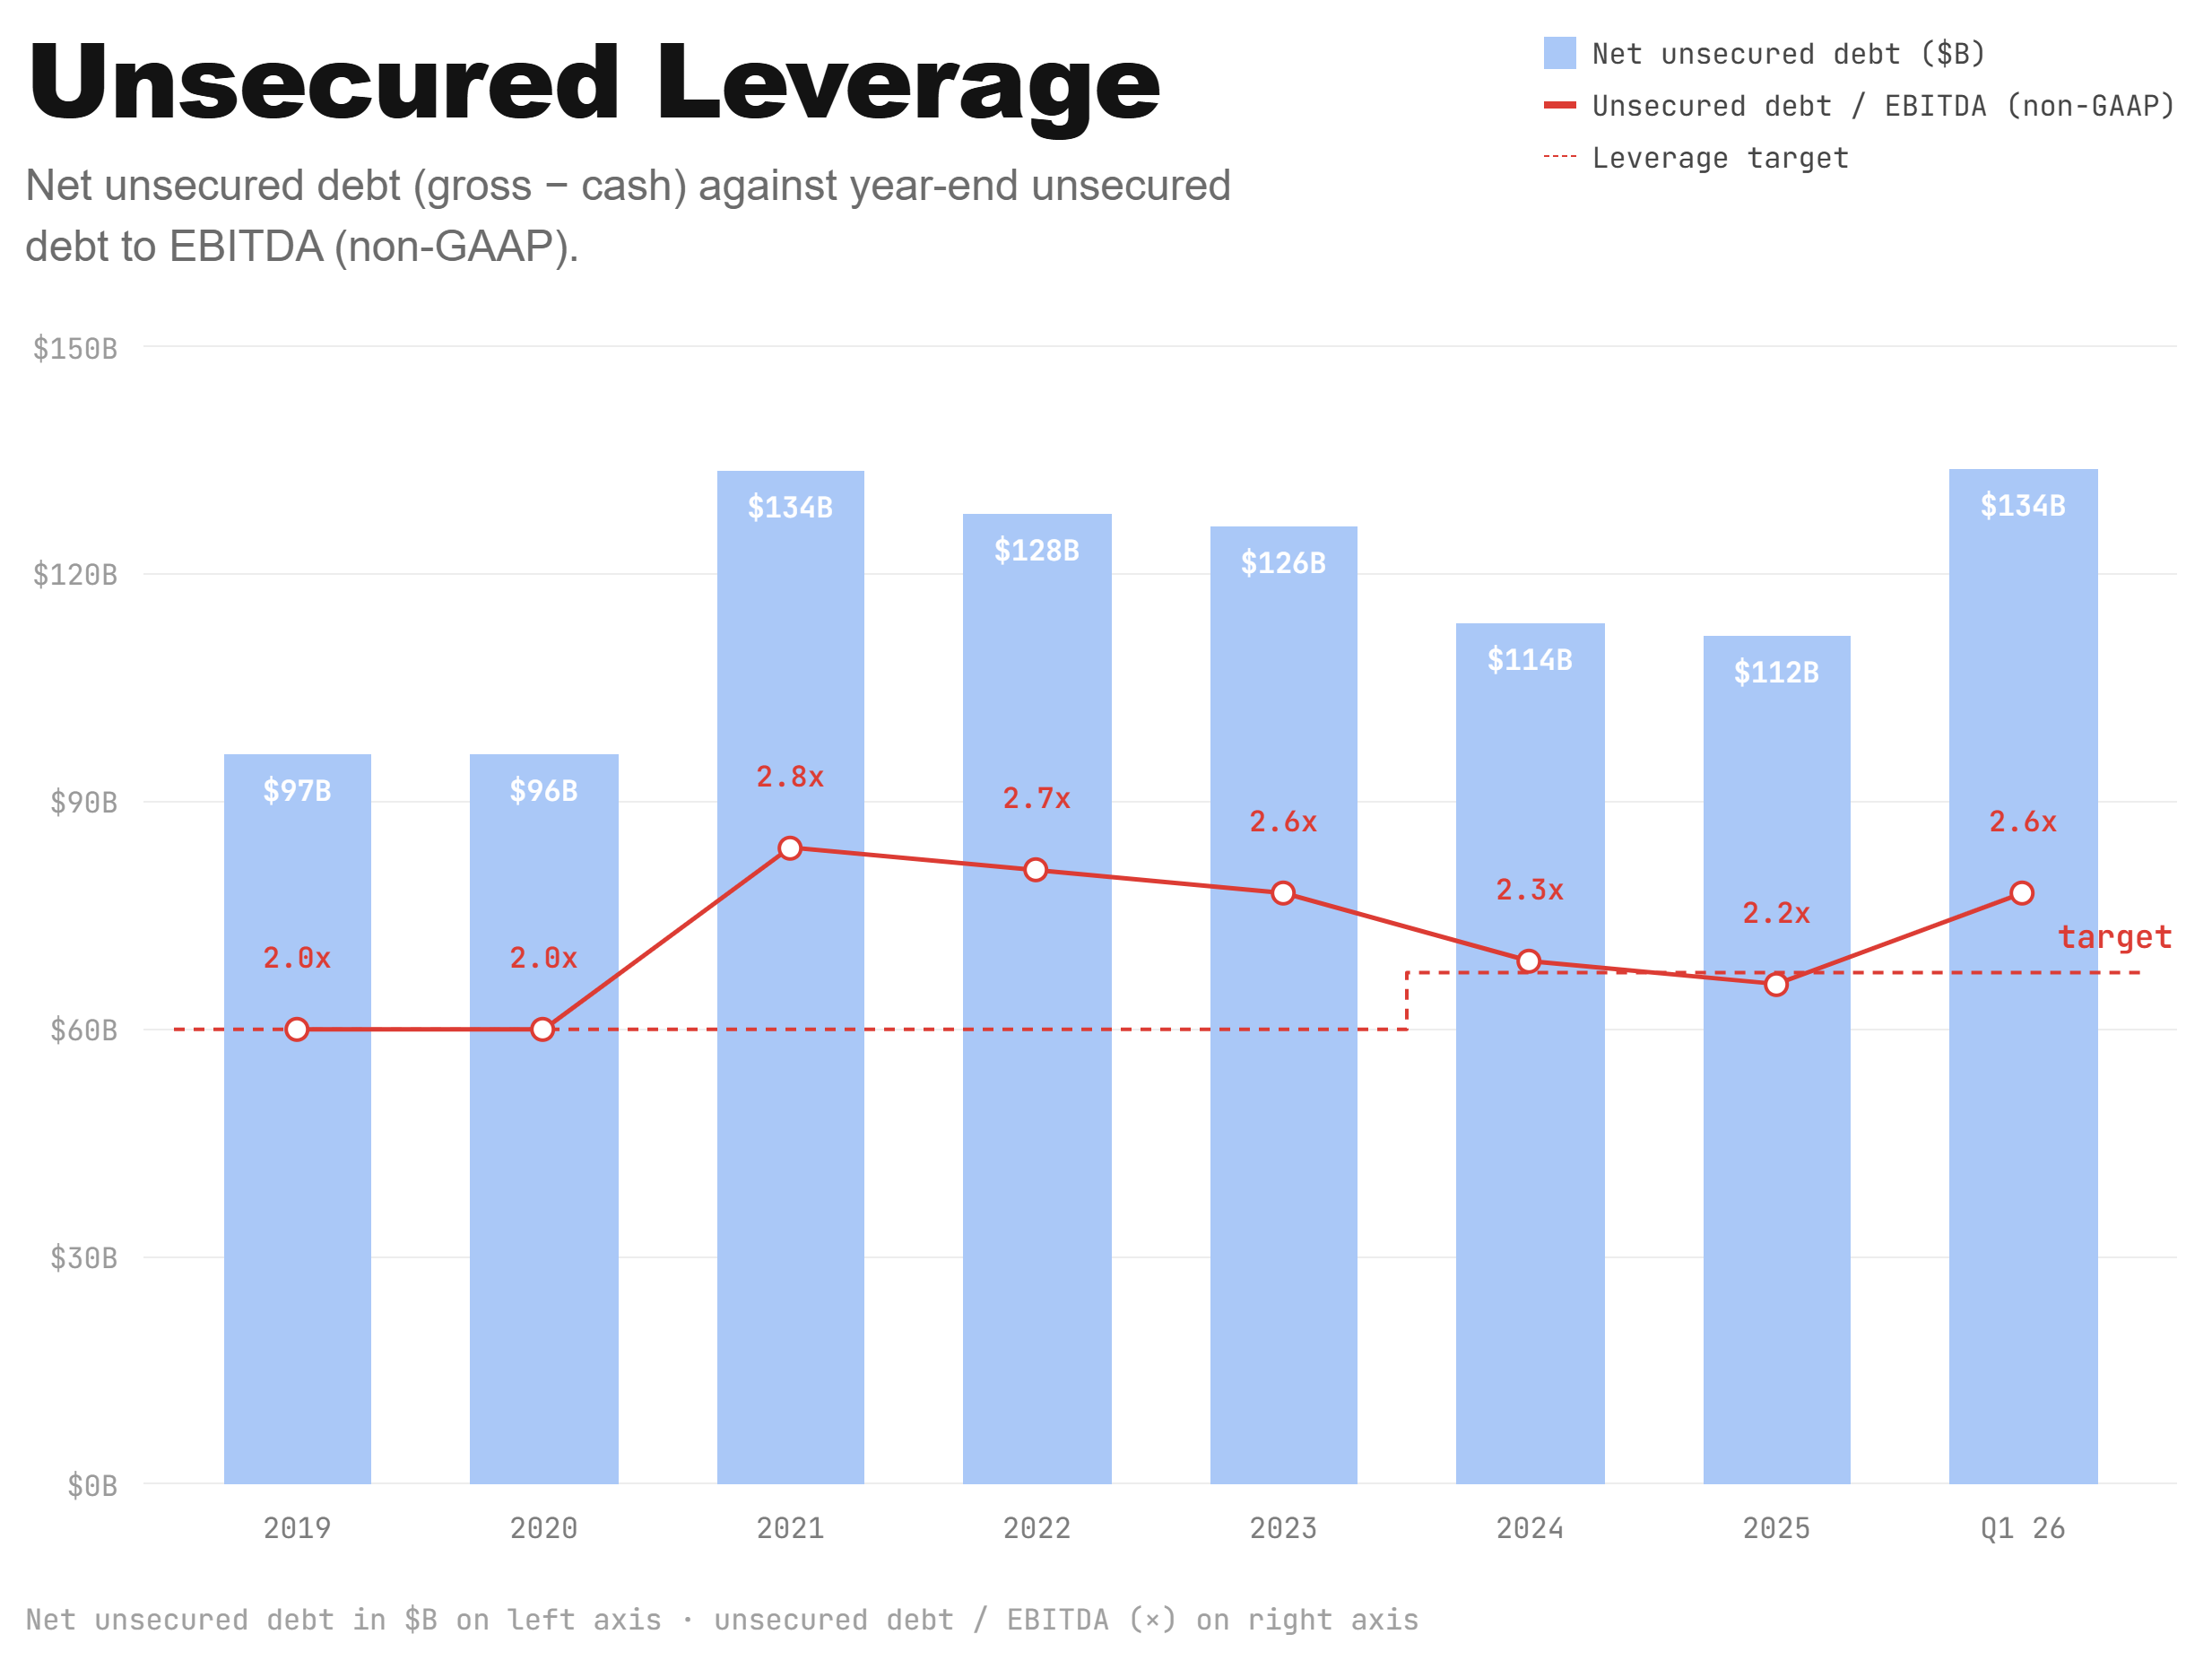
Verizon management, however, tracks unsecured leverage more closely. Unsecured debt is simply any debt that’s not backed by collateral. Their current target is an upper bound of 2.25x EBITDA. Following the Frontier merger, management has stated goals for bringing this back down in to target in the future.
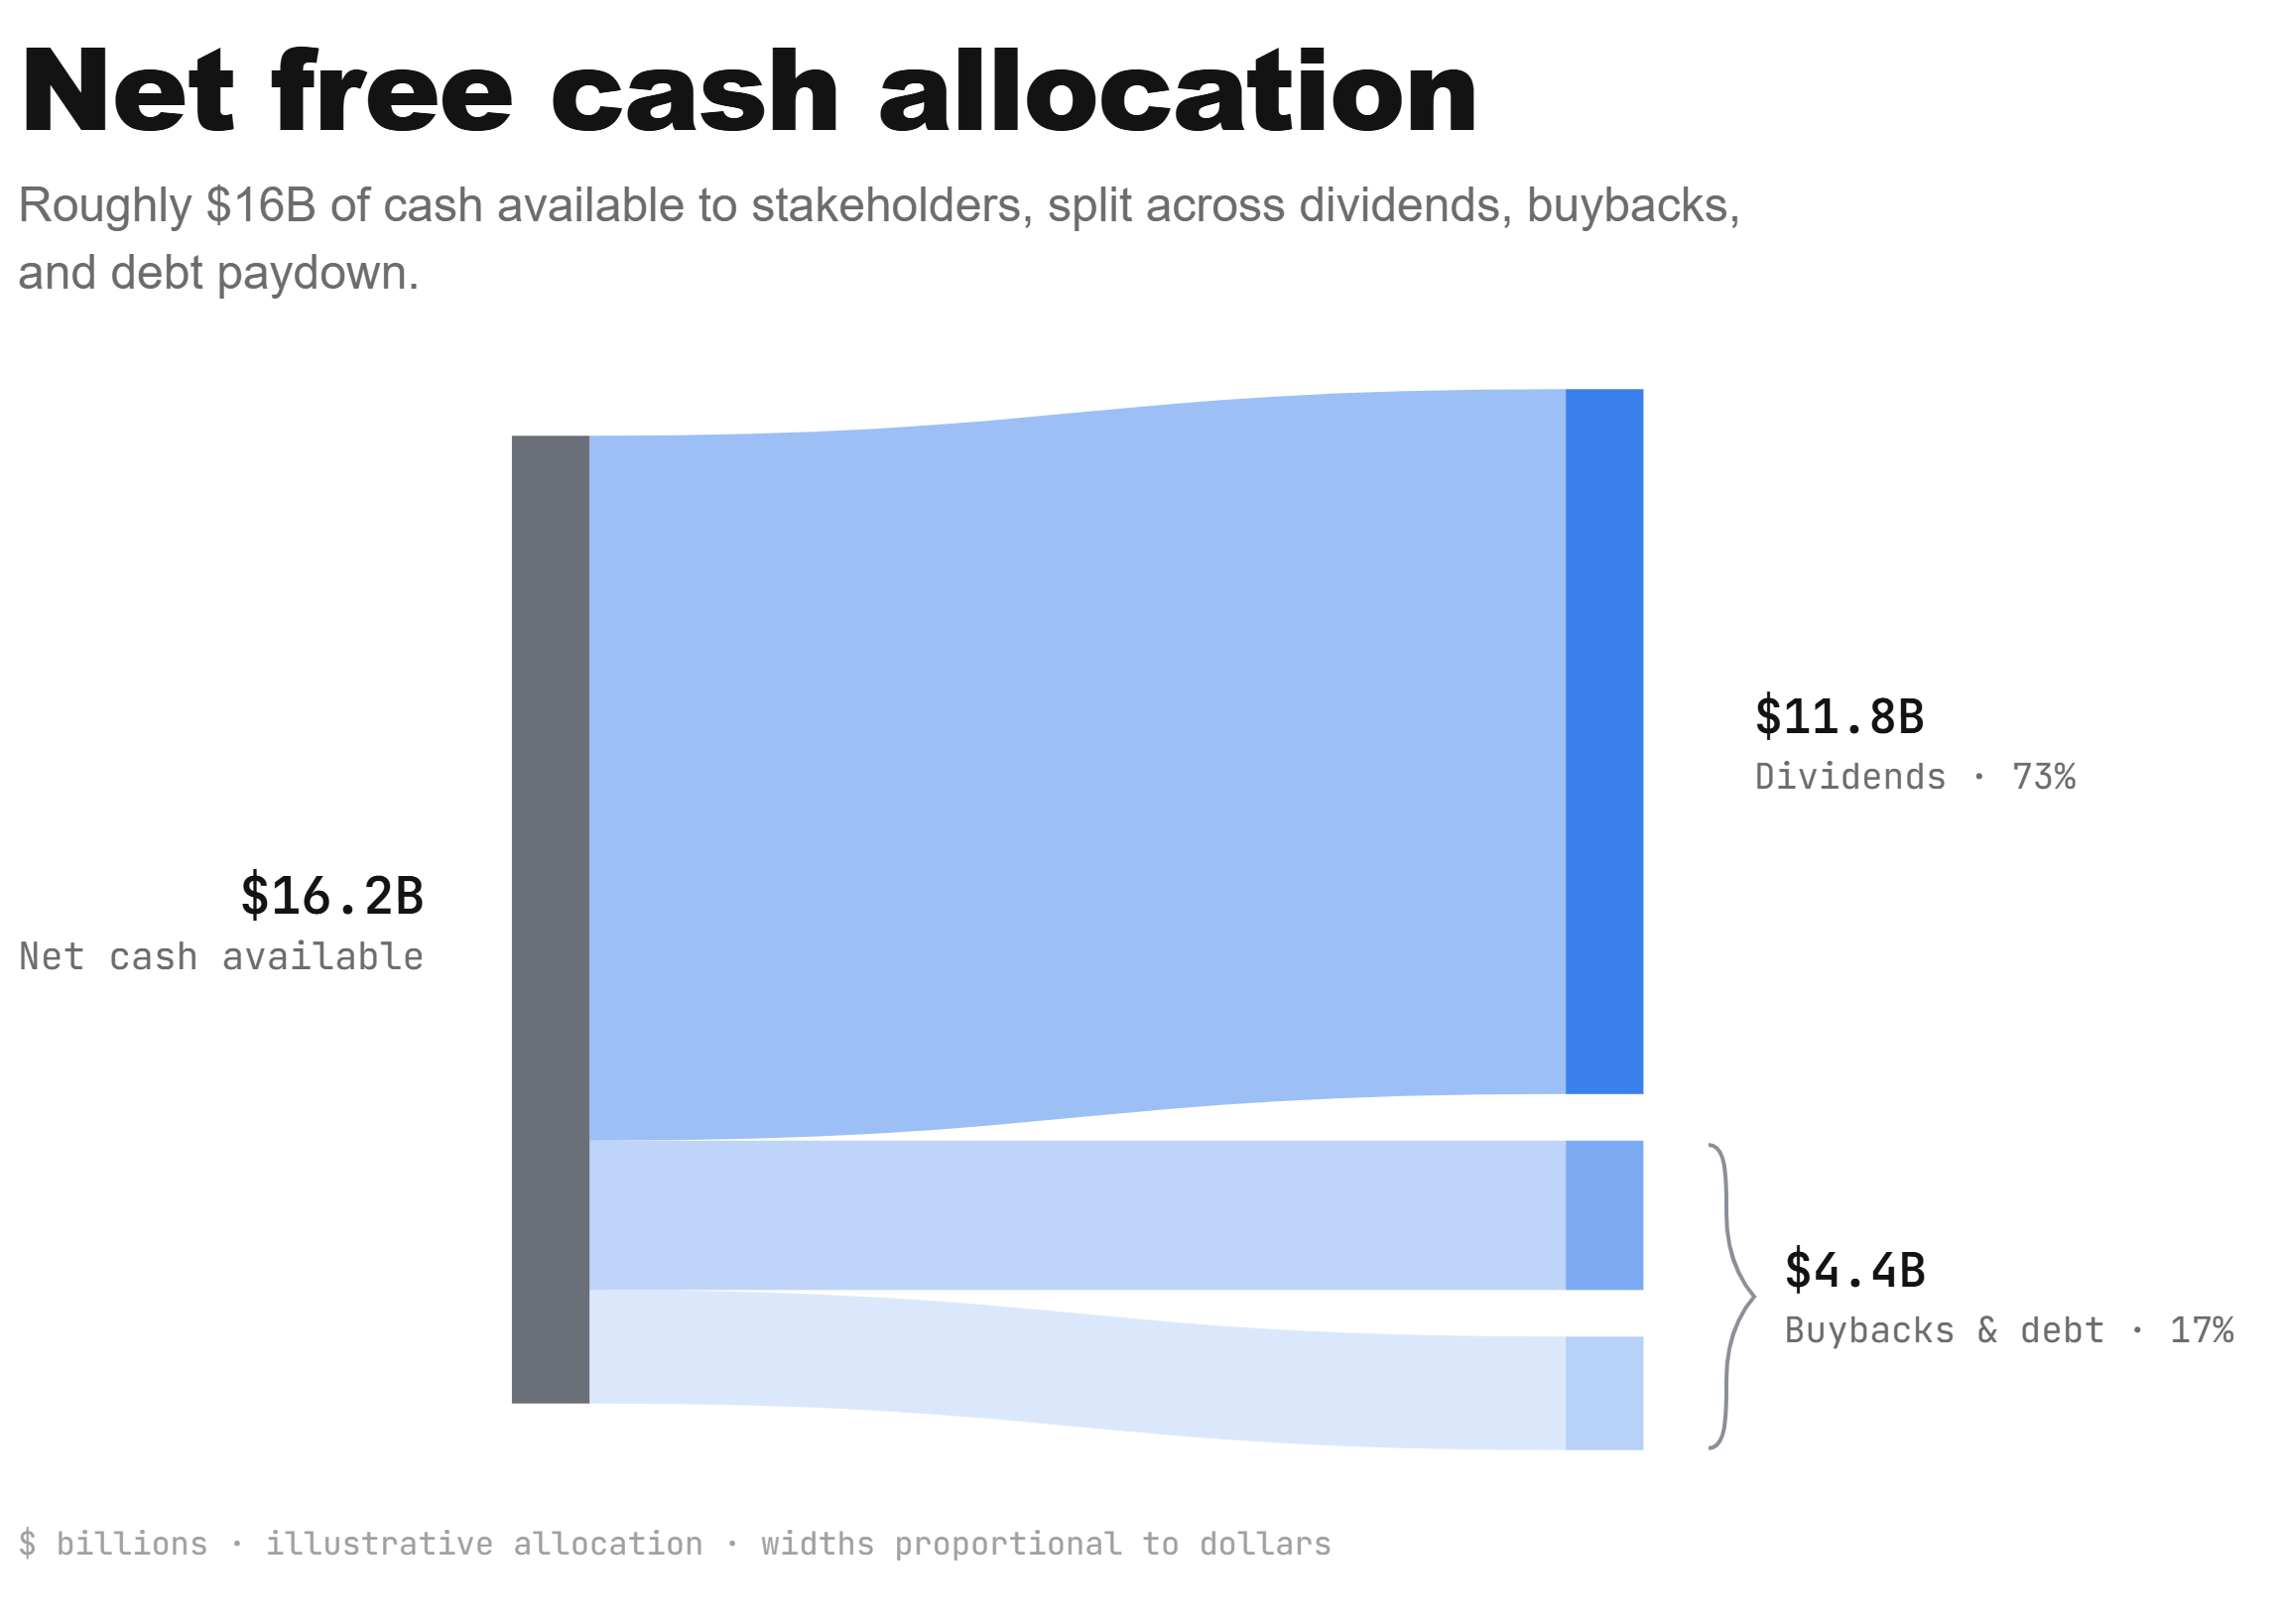
In order to move back to their stated goal of 2.25x, they’ll have to pay down roughly $18B (or increase EBITDA). With a Free Cash Flow level of ~$19B and their commitment of ~$11B toward dividends, it’ll take roughly 2.5 years to get their debt level back to target. This assumes no share repurchases.
4. Share Repurchases
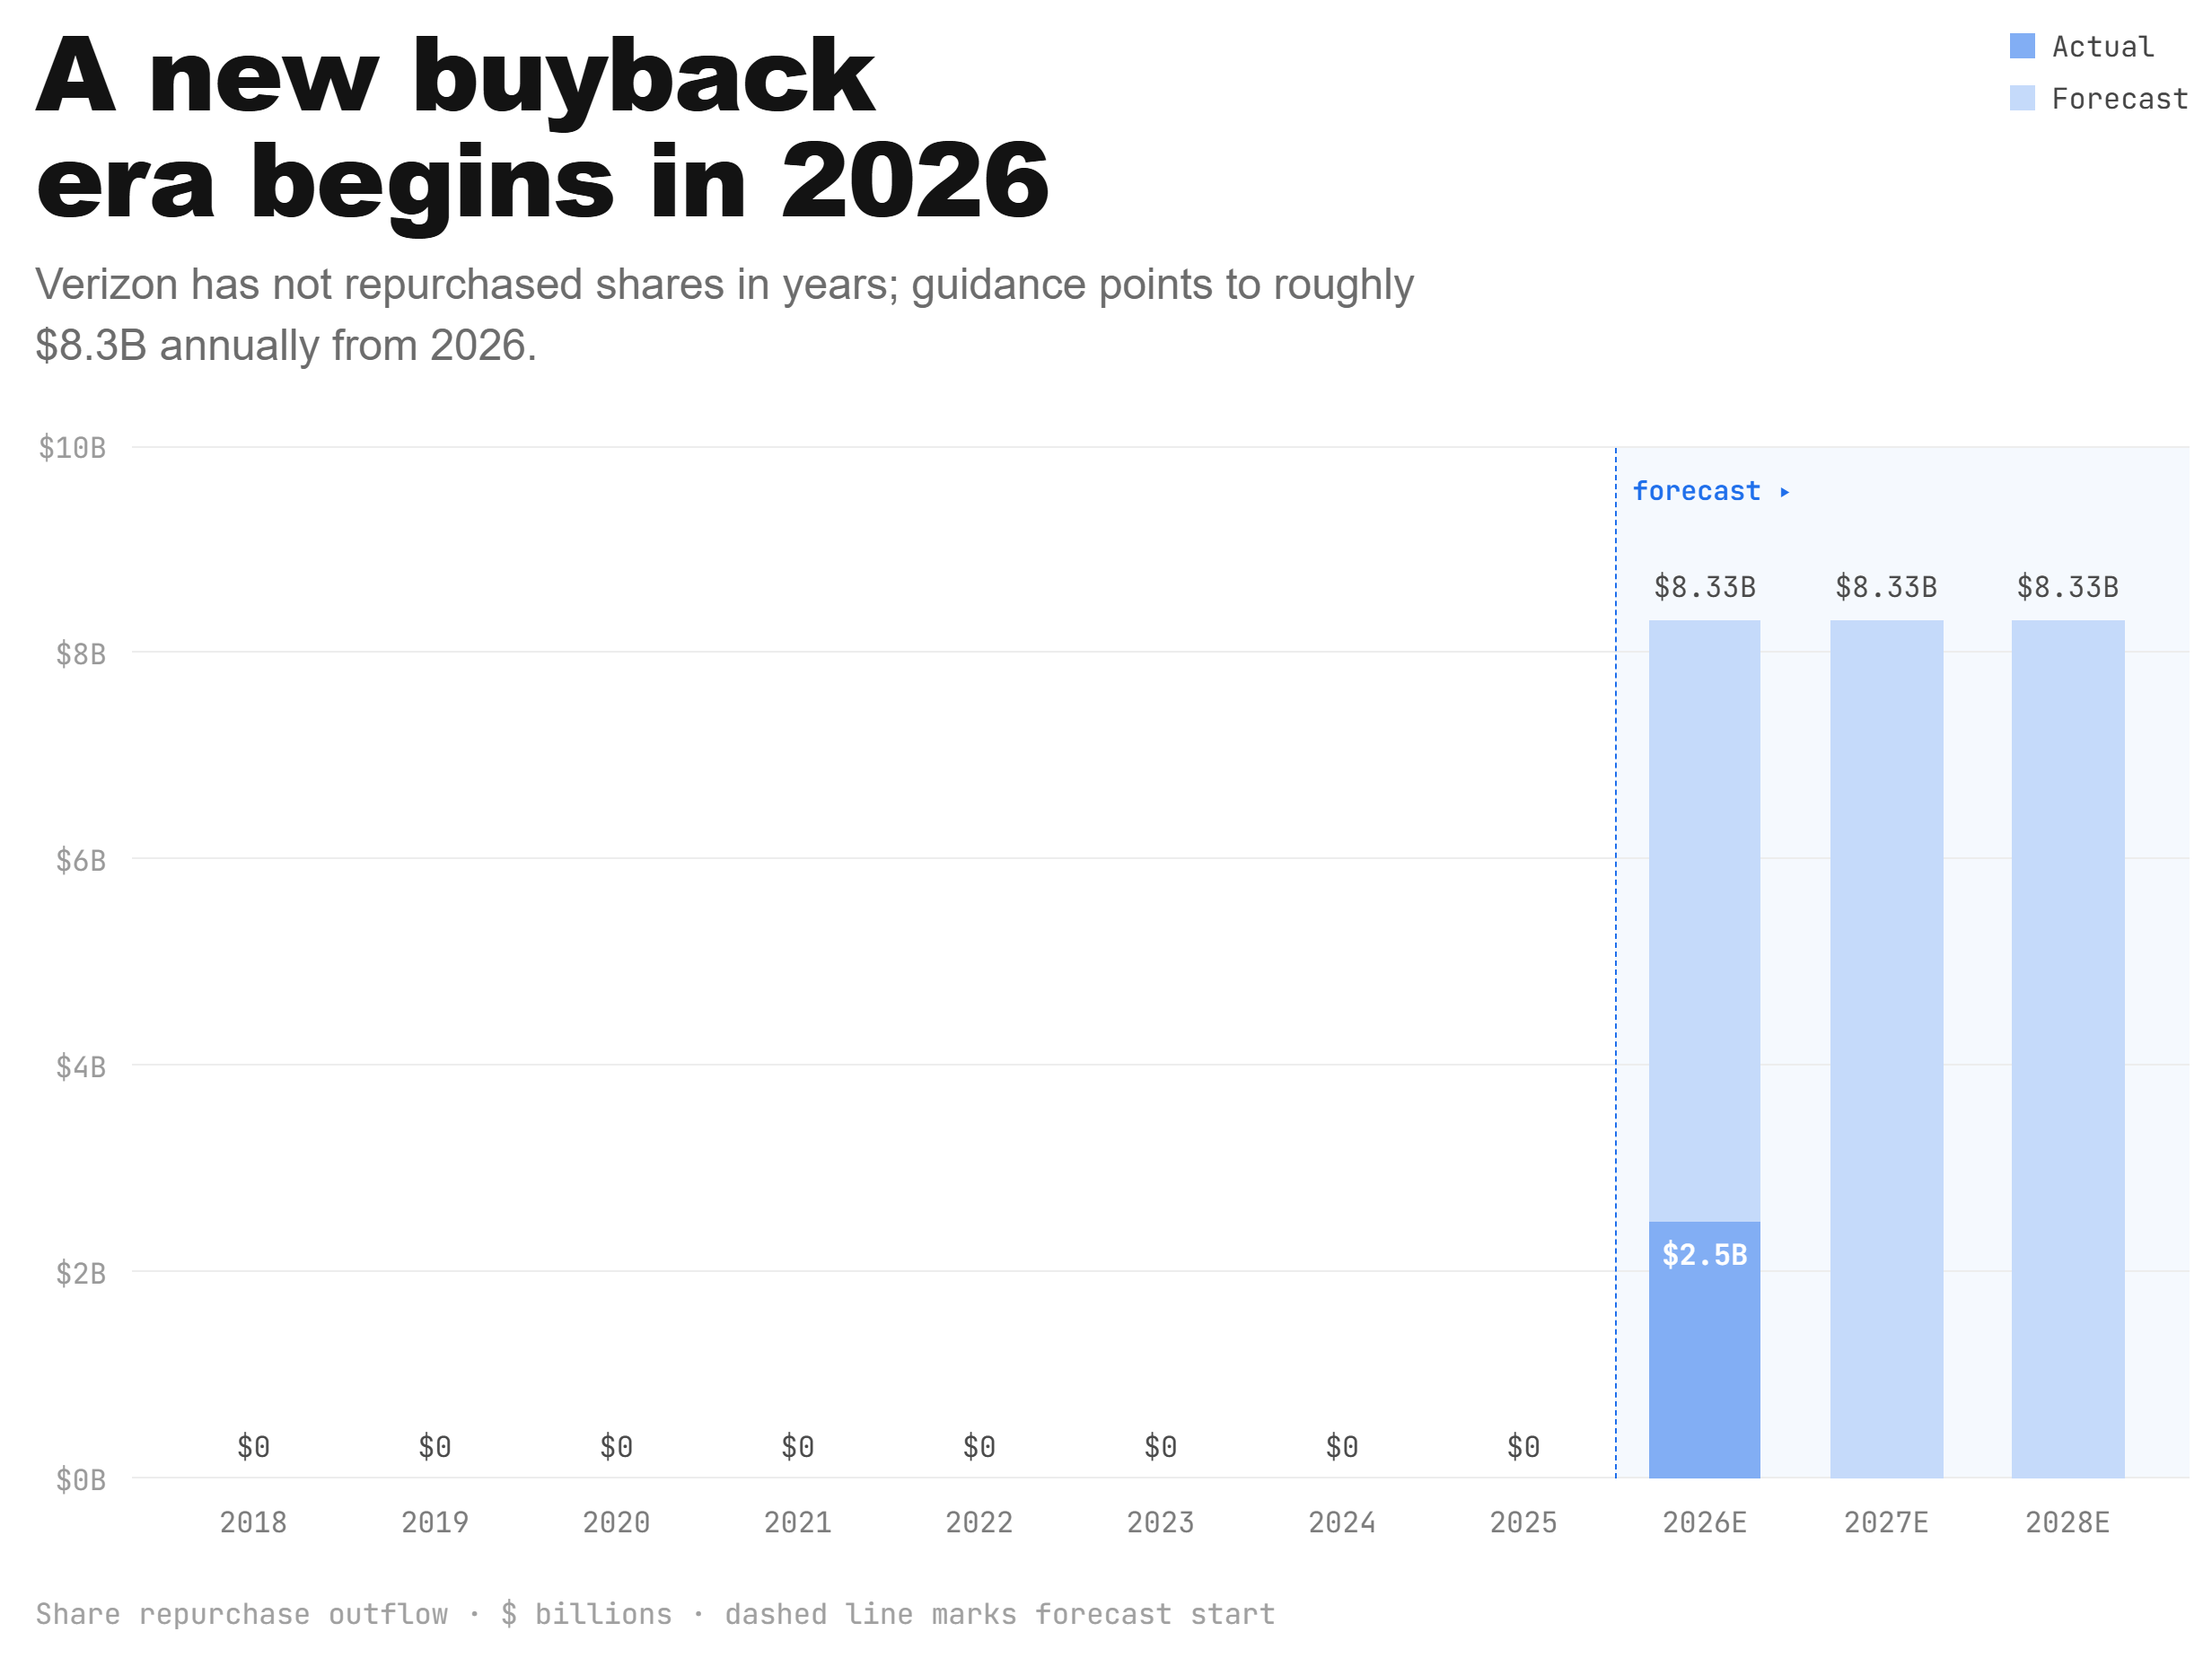
Looking back, Verizon management approved a share repurchase program in 2019 with an ambition to buy back 100 million shares over the following handful of years.
Instead, they purchased spectrum licenses (in 2021). They never bought back a single share under that program which was retired in 2025.
A new share repurchase program has been initiated starting in 2026. The new program allots $25B to be used towards share repurchases over the next three years (thru 2028).
In Q1 of 2026, they’ve actually done it. They deployed $2.5B and repurchased just over 50 million shares.
At $25B in total share repurchases, they could reduce total share count by nearly 15% over the next 3 years.
Valuation
For a business like this, where acquisitions are a regular part of annual operations, it’s not appropriate to work directly off of the traditional free cash flow metric (which excludes acquisition costs).
In order to estimate the capacity to maintain and expand the dividend, we can look at their historical cash flow habits. From there, we can start to normalize cash flows available to stakeholders in the business.
The image below shows the cashflow ‘waterfall’. CFO (gray) is the cash that the business brings in from daily operations. Cash flow from investments (blue) include all capex and acquisitions (purchasing spectrum or other businesses - i.e., Frontier). What’s left over (green or red) the cash flows available to the owners in the business, both debt holders and equity holders. Alternatively, these can also be retained by Verizon and held on the balance sheet for future use. Note that a red bar indicates that capital had to be raised from external stakeholders (i.e., equity or debt issuance).
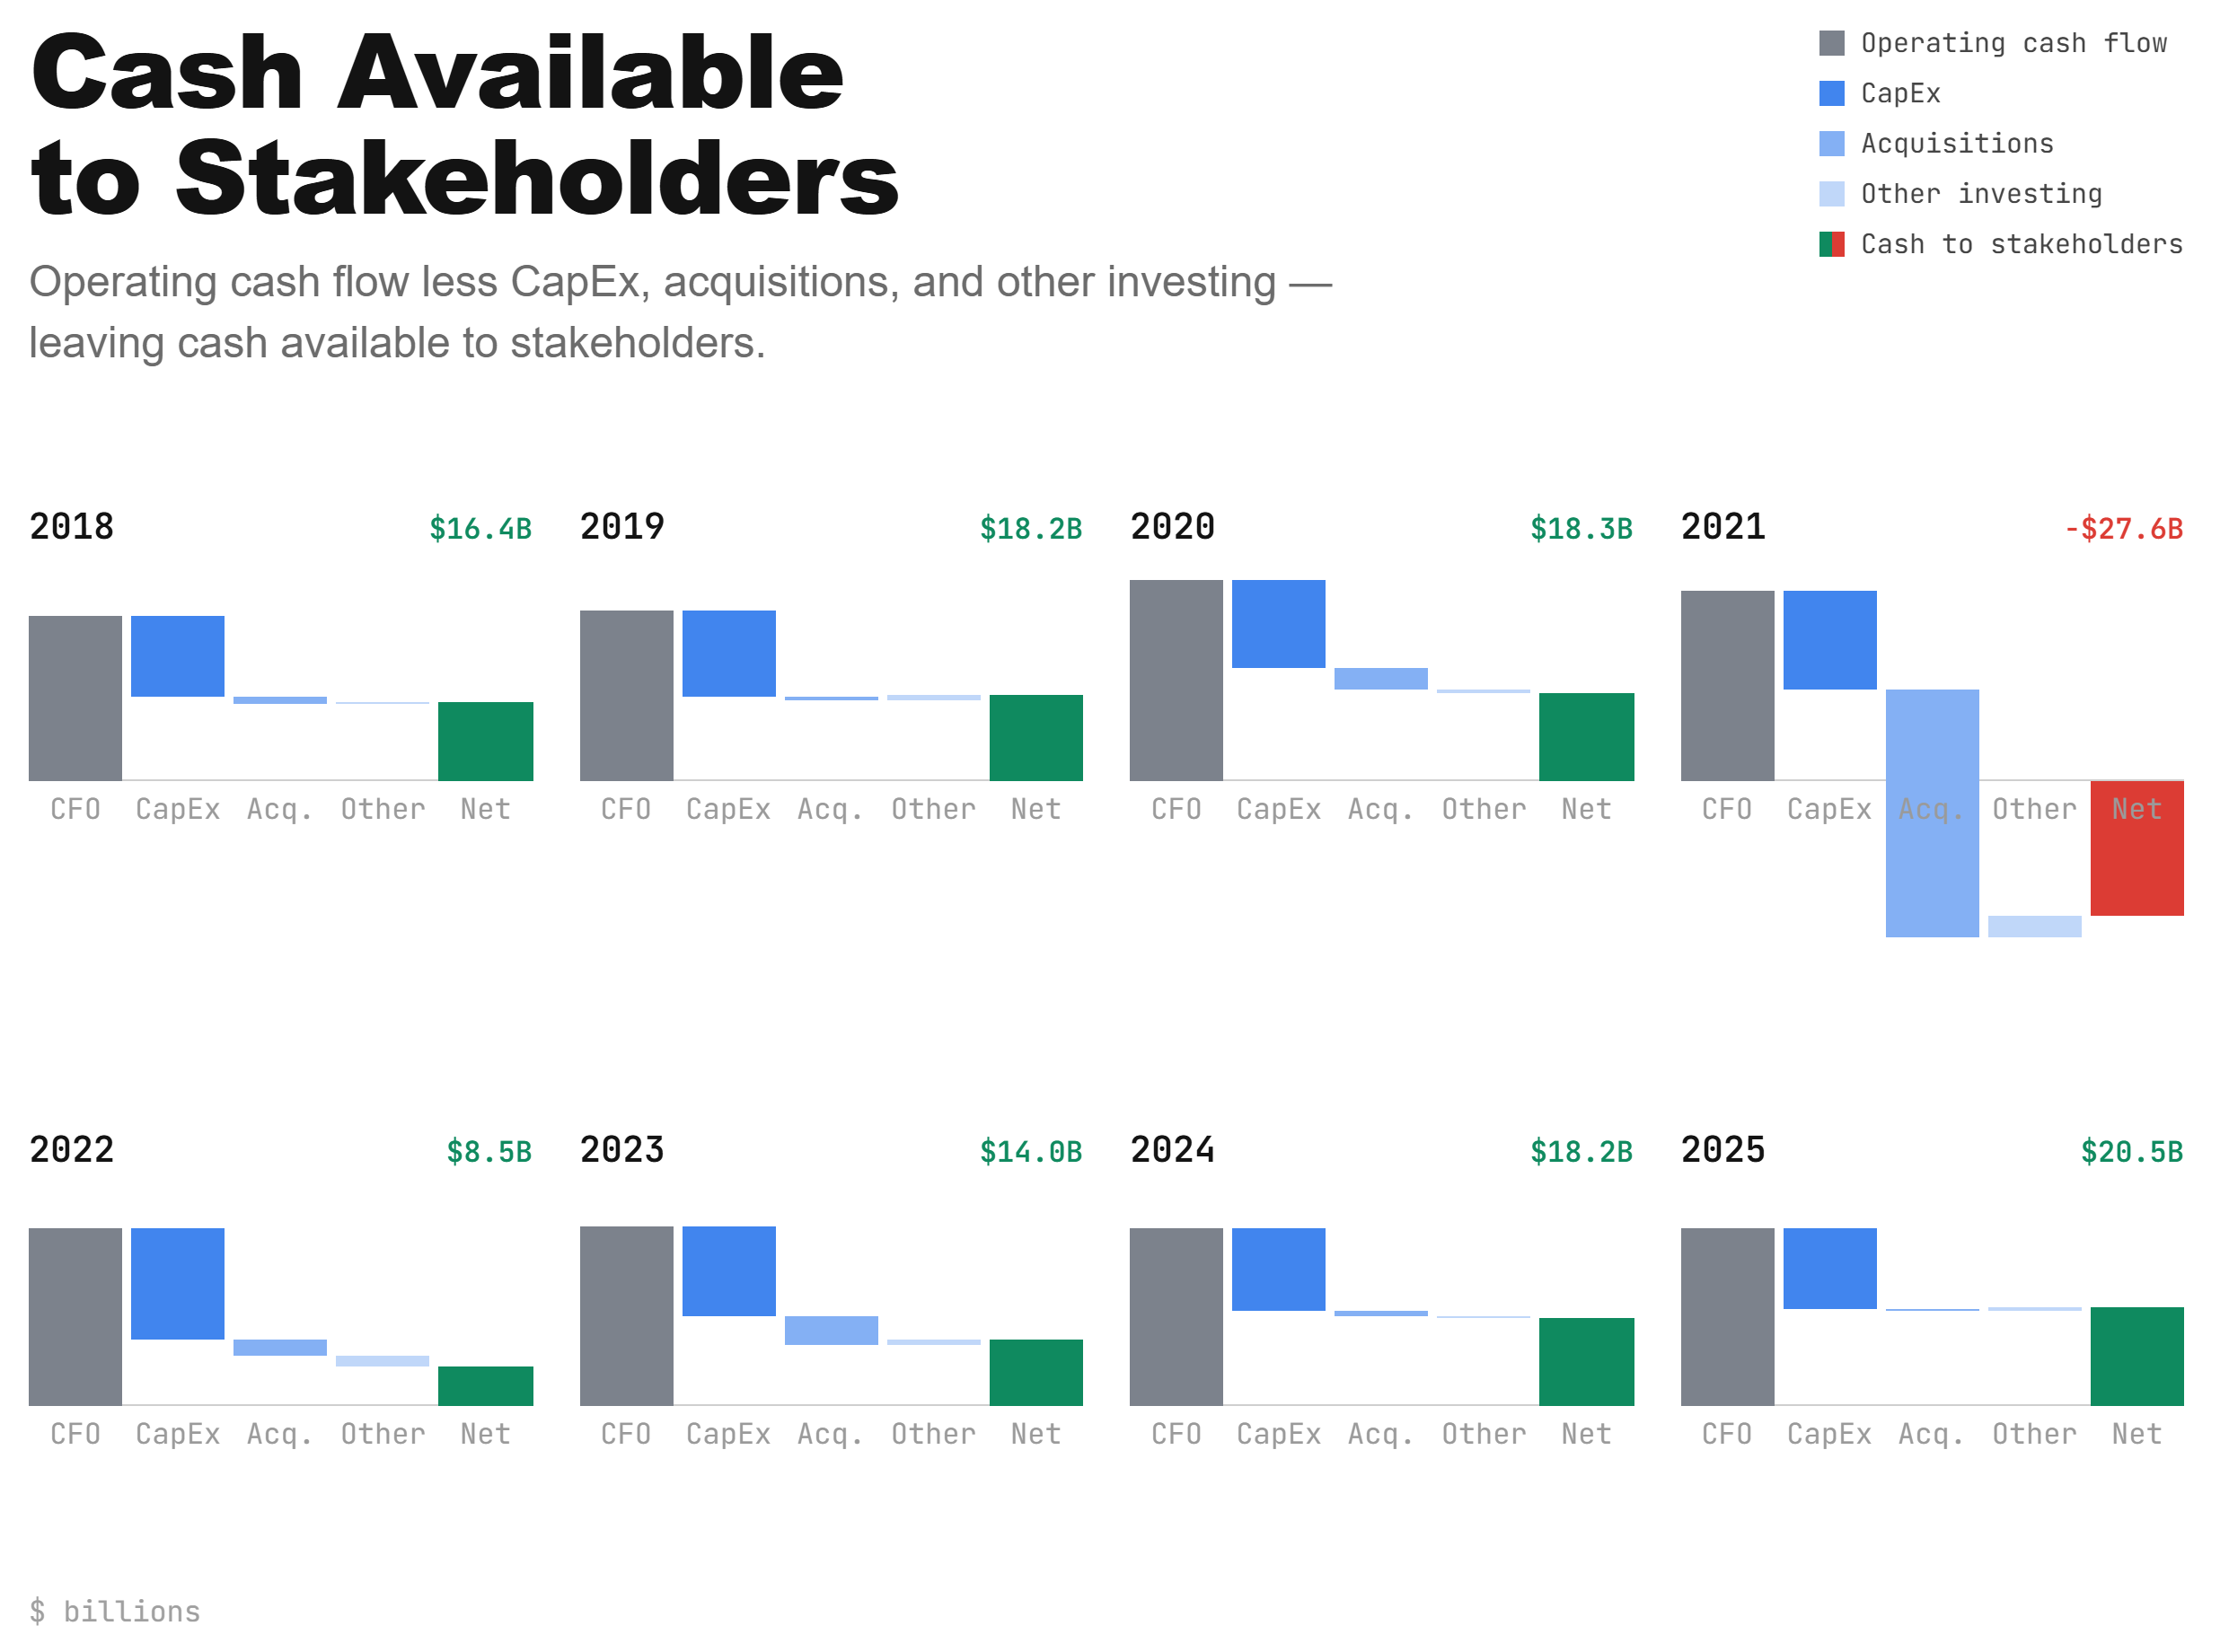
The headline is that over the past 8 years, Verizon has averaged $10.8B of cash flow available to investors. It’s worth pointing out that there can be churn within these buckets - while the net CF might be -27.6B in 2021, Verizon could have issued $37B in debt and paid out $10B in dividends (which is exactly what they did). But over the long run, the cash to be paid to stakeholders should broadly track net cash flows (CFO minus CFI).
This average number is a big problem for investors if they’re using the traditional free cash flow measure which shows a pretty steady $18.5B in annual FCF. Again, acquisitions are a big part of maintaining this business.
The spectrum deal in 2021 is a one-time $46B dump, though, and it may be more fair to amortize that cost across the full 15 year license agreement. Doing that, the normalized net cash flows are $16.2B. That’s the starting number we’ll use to work from.
This $16.2B headline number represents roughly a 9.3% shareholder yield. Naturally, not all of this money will go towards dividends and buybacks - some of it will go to debt reduction. But debt reduction can count towards shareholder yield in the way of reducing ongoing interest expenses (which can then flow to equity holders). See my post of Shareholder Yield for more.
Taking this as our starting point, I project the per-share dividends for the next 10 years. Note that the dividend grows north of 4% even though net cash flows are growing only 2%. This is the beauty of share repurchases.
Also note that I tried to project debt paydown roughly equal to what is needed to bring the leverage ratios back in line. And I estimated the interest that is freed up due to that debt paydown. That freed interest is added to every following year (i.e., Net Cash flow for 2028 = 16,200 x 1.022 + [95 + 97] = 17,047).
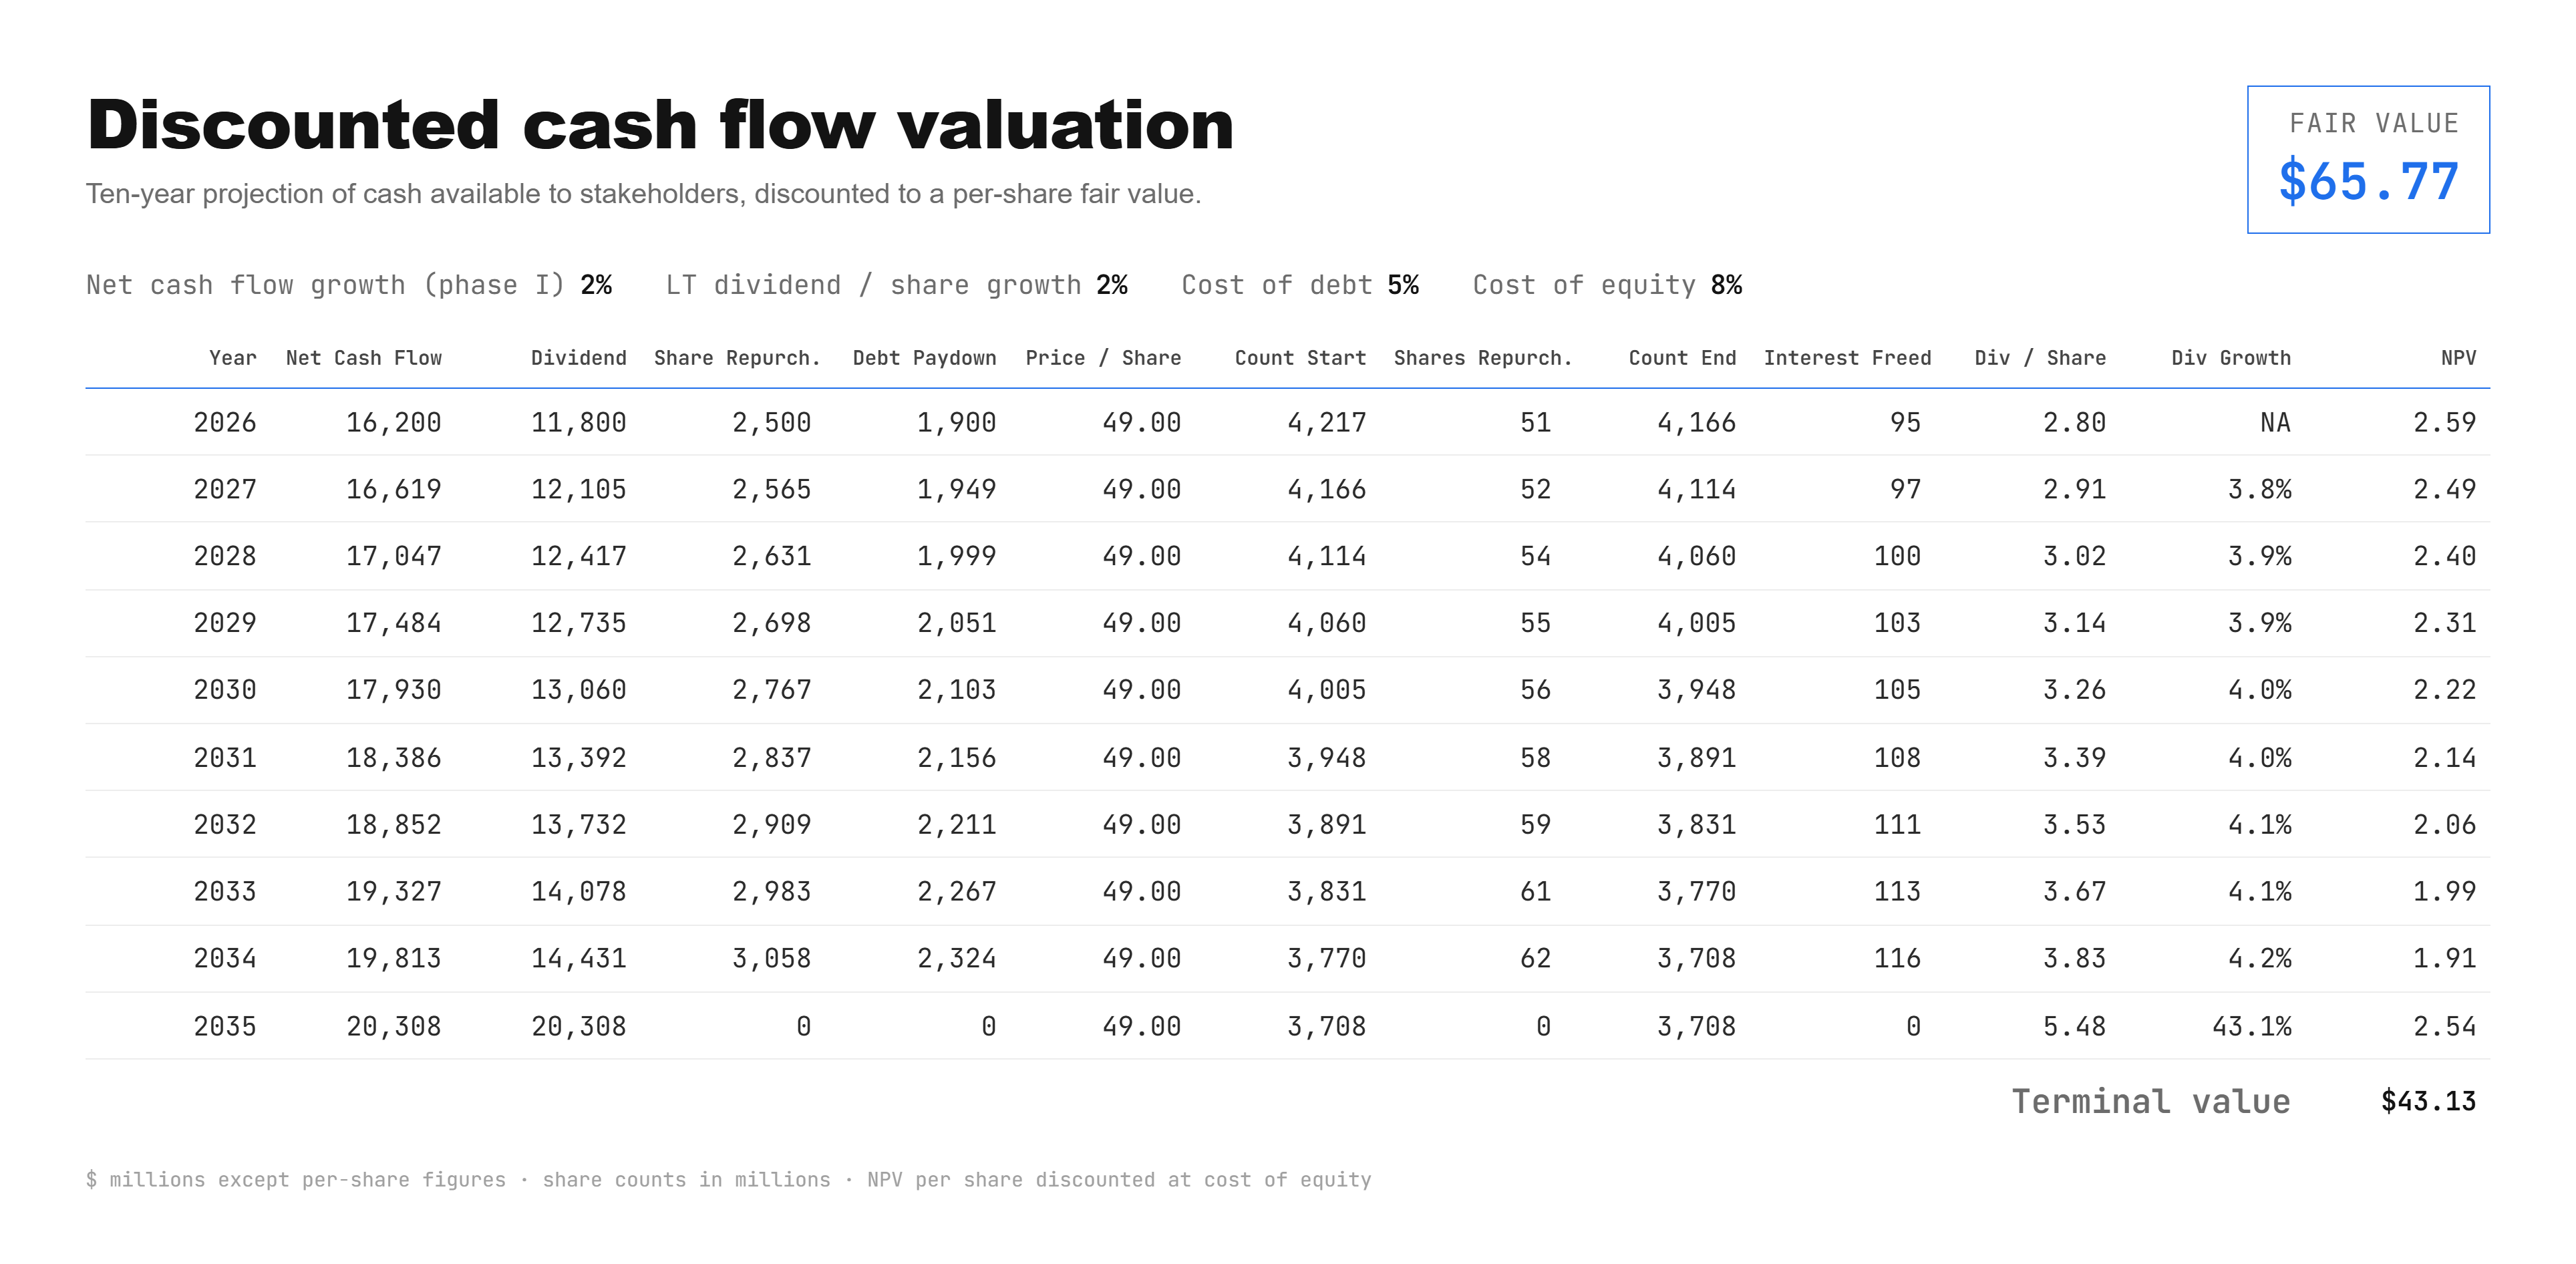
Even if organic net cash flow growth is zero, forever, the stock should be valued in the mid-to-high 40’s (roughly where it is today) and see an 8% annualized forward return.
Risks
Telecom services are largely a commodity product. You can differentiate a bit, but most costumers converge towards the best value proposition. Looking at all the players in this space, they all maintain low-double digit net margins…which are pretty decent for a sector like this. And most of the players have experienced margin expansion in recent years.
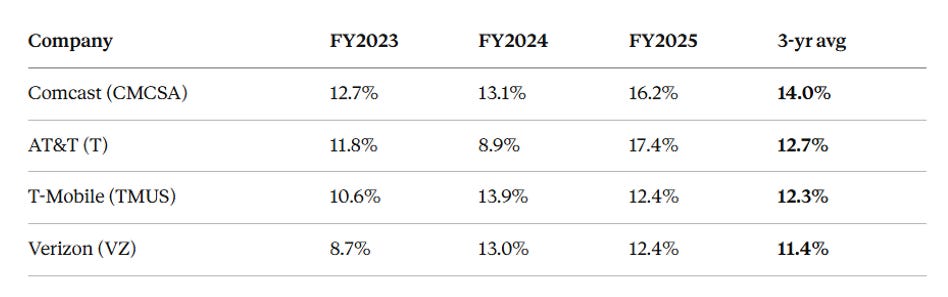
So I don’t know if the pie will grow or if Verizon has the capacity to take a bigger bite of the existing pie. Surface level research revealed that the C-Band spectrum that Verizon purchased in 2021 is the most desirable range of the spectrum - offering the best combination of fast speeds and object penetration (for interior use). I’m no expert so that’s as far as I’m willing speculate on that.
I do wonder about disruption risk. Cable and Satellite got their lunch eaten by streaming in the 2010s, and I do wonder if there will come an alternative to legacy wireless and broadband that can squash the market as it exists today. There currently exist few spacefaring companies (ASTS and SpaceX) that spin a good story, but I don’t think the physics works for anything other than gap coverage. If anything ASTS will be an add-on service for existing telecoms, and Verizon is more likely to get a cut of the expanded coverage offerings than lose market share because of it. But that’s something to keep an eye on.
And of course there’s always the risk that the level of acquisitions required to overcome churn will balloon out of control. These telecoms talk a big game when it comes to smart capital allocation, and then they’ll immediately turn around and buy a theme park or something. I’m not going to cast judgement on the Frontier acquisition just yet, but Frontier has never returned cash flows, on-net, to shareholders in the past decade. A lot of that was driven by expansion of their Fiber network, but we’ll see if that pays dividends post acquisition.
Summary
You’ll notice that I didn’t touch on fiber passings, post paid phone adds, or the economics of their C-Band rollout. As evidenced by their revenue growth, I consider most of these ‘expansion’ efforts as just treading water and a way to keep the business a going concern.
But, while the business is highly capital intensive and low growth, they clearly have the capacity to continue generating gobs of net cash flows. The dividend is clearly resilient as evidenced by their track record and low payout ratios. And at a no-growth 9% shareholder yield and a 6.7% dividend rate, it seems like a pretty decent floor is placed under the stock. This is one you can coffee can away for 10 years, reinvest the dividends in broadly diversified holdings, and it’s hard to imagine a scenario where you’ll be disappointed. It might not burn the doors off, but should offer better than treasury yield returns with solid potential for upside.
Forecast (7/16/2026): My 5-year forward return forecast is 12-14% CAGR (assumes dividends reinvested)