

Forecasting Dilution
What 10,000+ Public Offerings Reveal About Timing and Returns

A dilution screen with current at-risk companies is located at the bottom of the article.
If you’re an investor in small cap stocks or early stage companies, you might be well acquainted with the feeling of an overnight dilution event hitting the tape. The company is hitting milestones and the stock is performing well, and then it hits. A dilution related SEC filing is announced, and the stock tanks after-hours.
In early July of 2026, Rivian announced a major equity raise to fund their R2 buildout. Their stock answered with a sharp 20% sell-off.
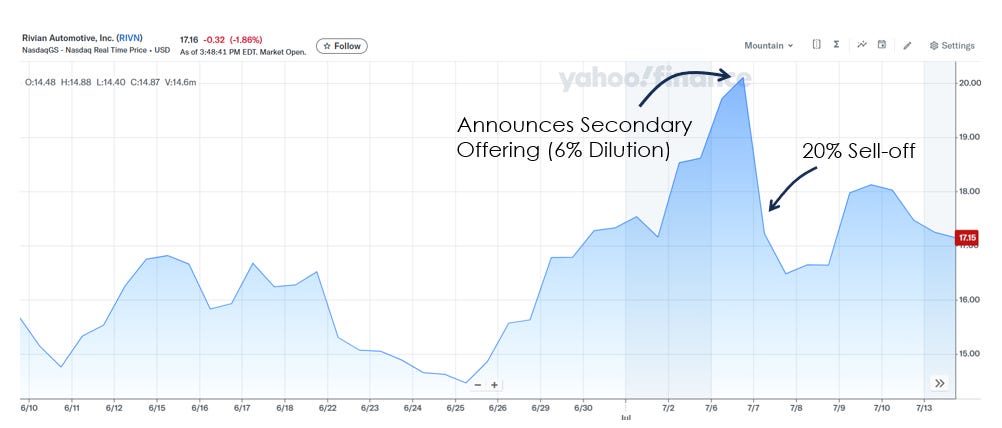
The question is “Is this something that we can predict?”
Note that I personally don’t view dilution as the black eye that many investors see it - see my article Dilution: When Less is More - but, whether it’s mechanical (supply / demand dynamics following a supply glut of shares hitting the marketplace) or fundamental, you can’t help but notice the pattern of weak performance following dilution events.
So I decided to dig deeper. I wanted to answer the following questions:
Can we predict who will dilute?
Can we time when they’ll dilute?
Can we profit from it?
Predicting Diluters
The underlying mechanics of dilution are pretty basic. If a company doesn’t have the liquidity to fund existing or future operations, they’ll have to come up with that capital somewhere. At it’s core, it largely comes down to the cash level that a company has and their rate of cash burn.
With that basic premise in mind, I built out a very simple logistic regression.
Note that I define a dilution event as any quarter where common stock issuance in dollars (found in financing cash flows) was greater than 1% of the market cap at the start of the period. This filters out any type of stock option exercising that might be done internally at the company. I also didn’t want to look at raw share counts which would include stock based compensation. My goal was to find discrete dilution events.
One final note on methodology. Because financial results aren’t made public until well after the quarter close (sometimes as much as two months), the appropriate adjustment is to use a two period look-ahead window. For instance, Q4 closes on December 31st, but a company might not report their financials until mid February. So by the time we actually get Q4 results, half of Q1 is over and the company may have already raised capital (this is often the case). So we’ll use Q4 results to forecast a Q2 raise (two period look-ahead).
Here are the results:
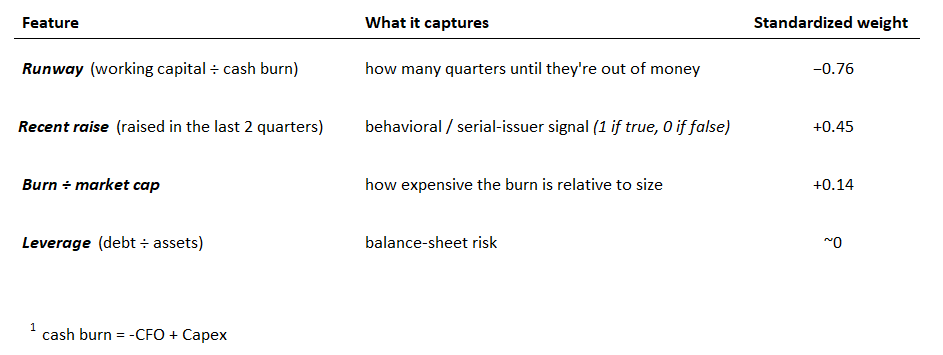
This table shows that shorter cash runways are associated with a higher likelihood of a cash raise. This matches intuition.
One thing that surprised me was the ‘recent raise’ parameter. I initially assumed that a company that had just raised capital was less likely to raise again in the near future - expecting a negative coefficient. It turns out that companies that have raised in the past are likely to raise again in the future.
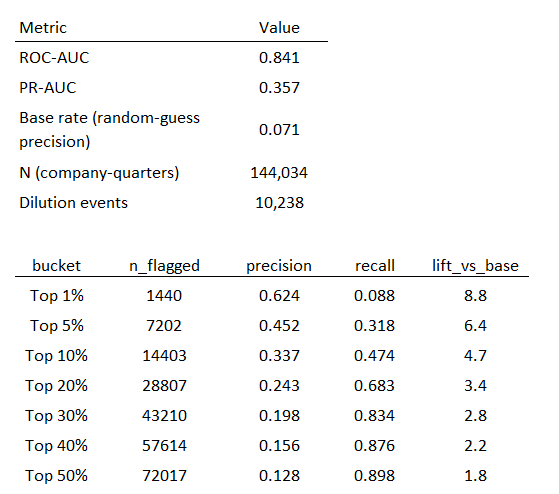
Validation
Predicting When
The goal of this study was to pull something actionable from the data. I wanted to see if I could time these events…with the hope that we could short these names or at least inform near term expected returns (it would be nice to buy Rivian after the equity raise instead of before).
So naturally, the next question is ‘when’.
I pulled the filings for every U.S. company back to mid 2021 and, with the help of AI in classification, I tried to nail down exact dates for dilution events. Since mid 2021, there were >5,000 events logged. Many of them aren’t directly tied to a filing (ATMs, for instance, have become very prominent since Covid). Filtering those out, we’re left with just over 3,000 discrete dilution events in the past 5 years.
Time of Year
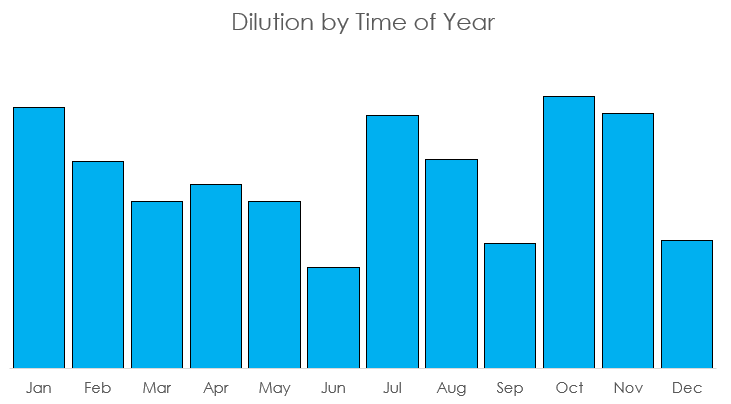
Figure 4 shows that dilution events spike in January, July, and October; all in the month following the previous quarter end.
Timing Within Quarter
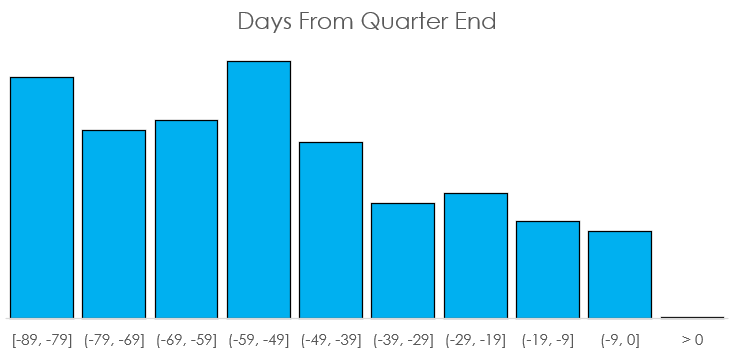
Figure 5 illustrates that dilution usually occurs earlier in the quarter. My initial hunch was that these will be clustered around earnings calls. Figure 6 looks at that.
Timing Around Earnings Calls
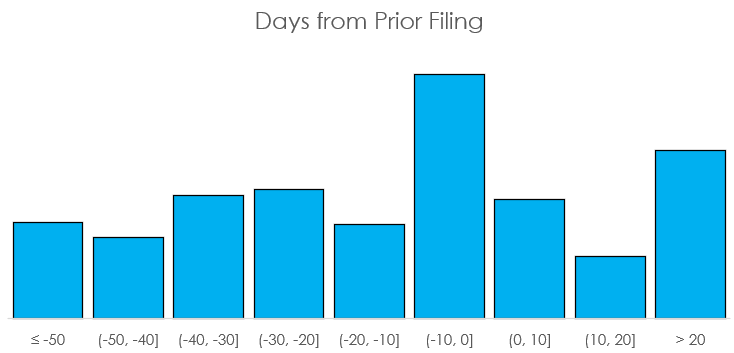
This shows that the majority of dilution events (about 70%) happen before or on earnings report dates. This reinforces the two-period lookahead decision that we made in the model construction phase - most dilutions will have already happened by the time we get the data for a one-period lookahead window.
Timing Summary
This data is pretty clear. Most dilution events are announced after the prior quarter ends and before earnings are reported. January, July, October, and November are the heaviest dilution months of the year. June, September, and December are notably safer from dilution events.
Performance
The last question we want to answer is about returns.
Performance from Event Date
Using the same 2021 and-on data set from Figures 4-6, we can measure the typical medium term performance from the exact dilution event announcement.
One thing to note is that while there is an immediate drop, the initial reaction isn’t as pronounced as I would have imagined. Rather, performance is typically a slow bleed following the dilution announcement.
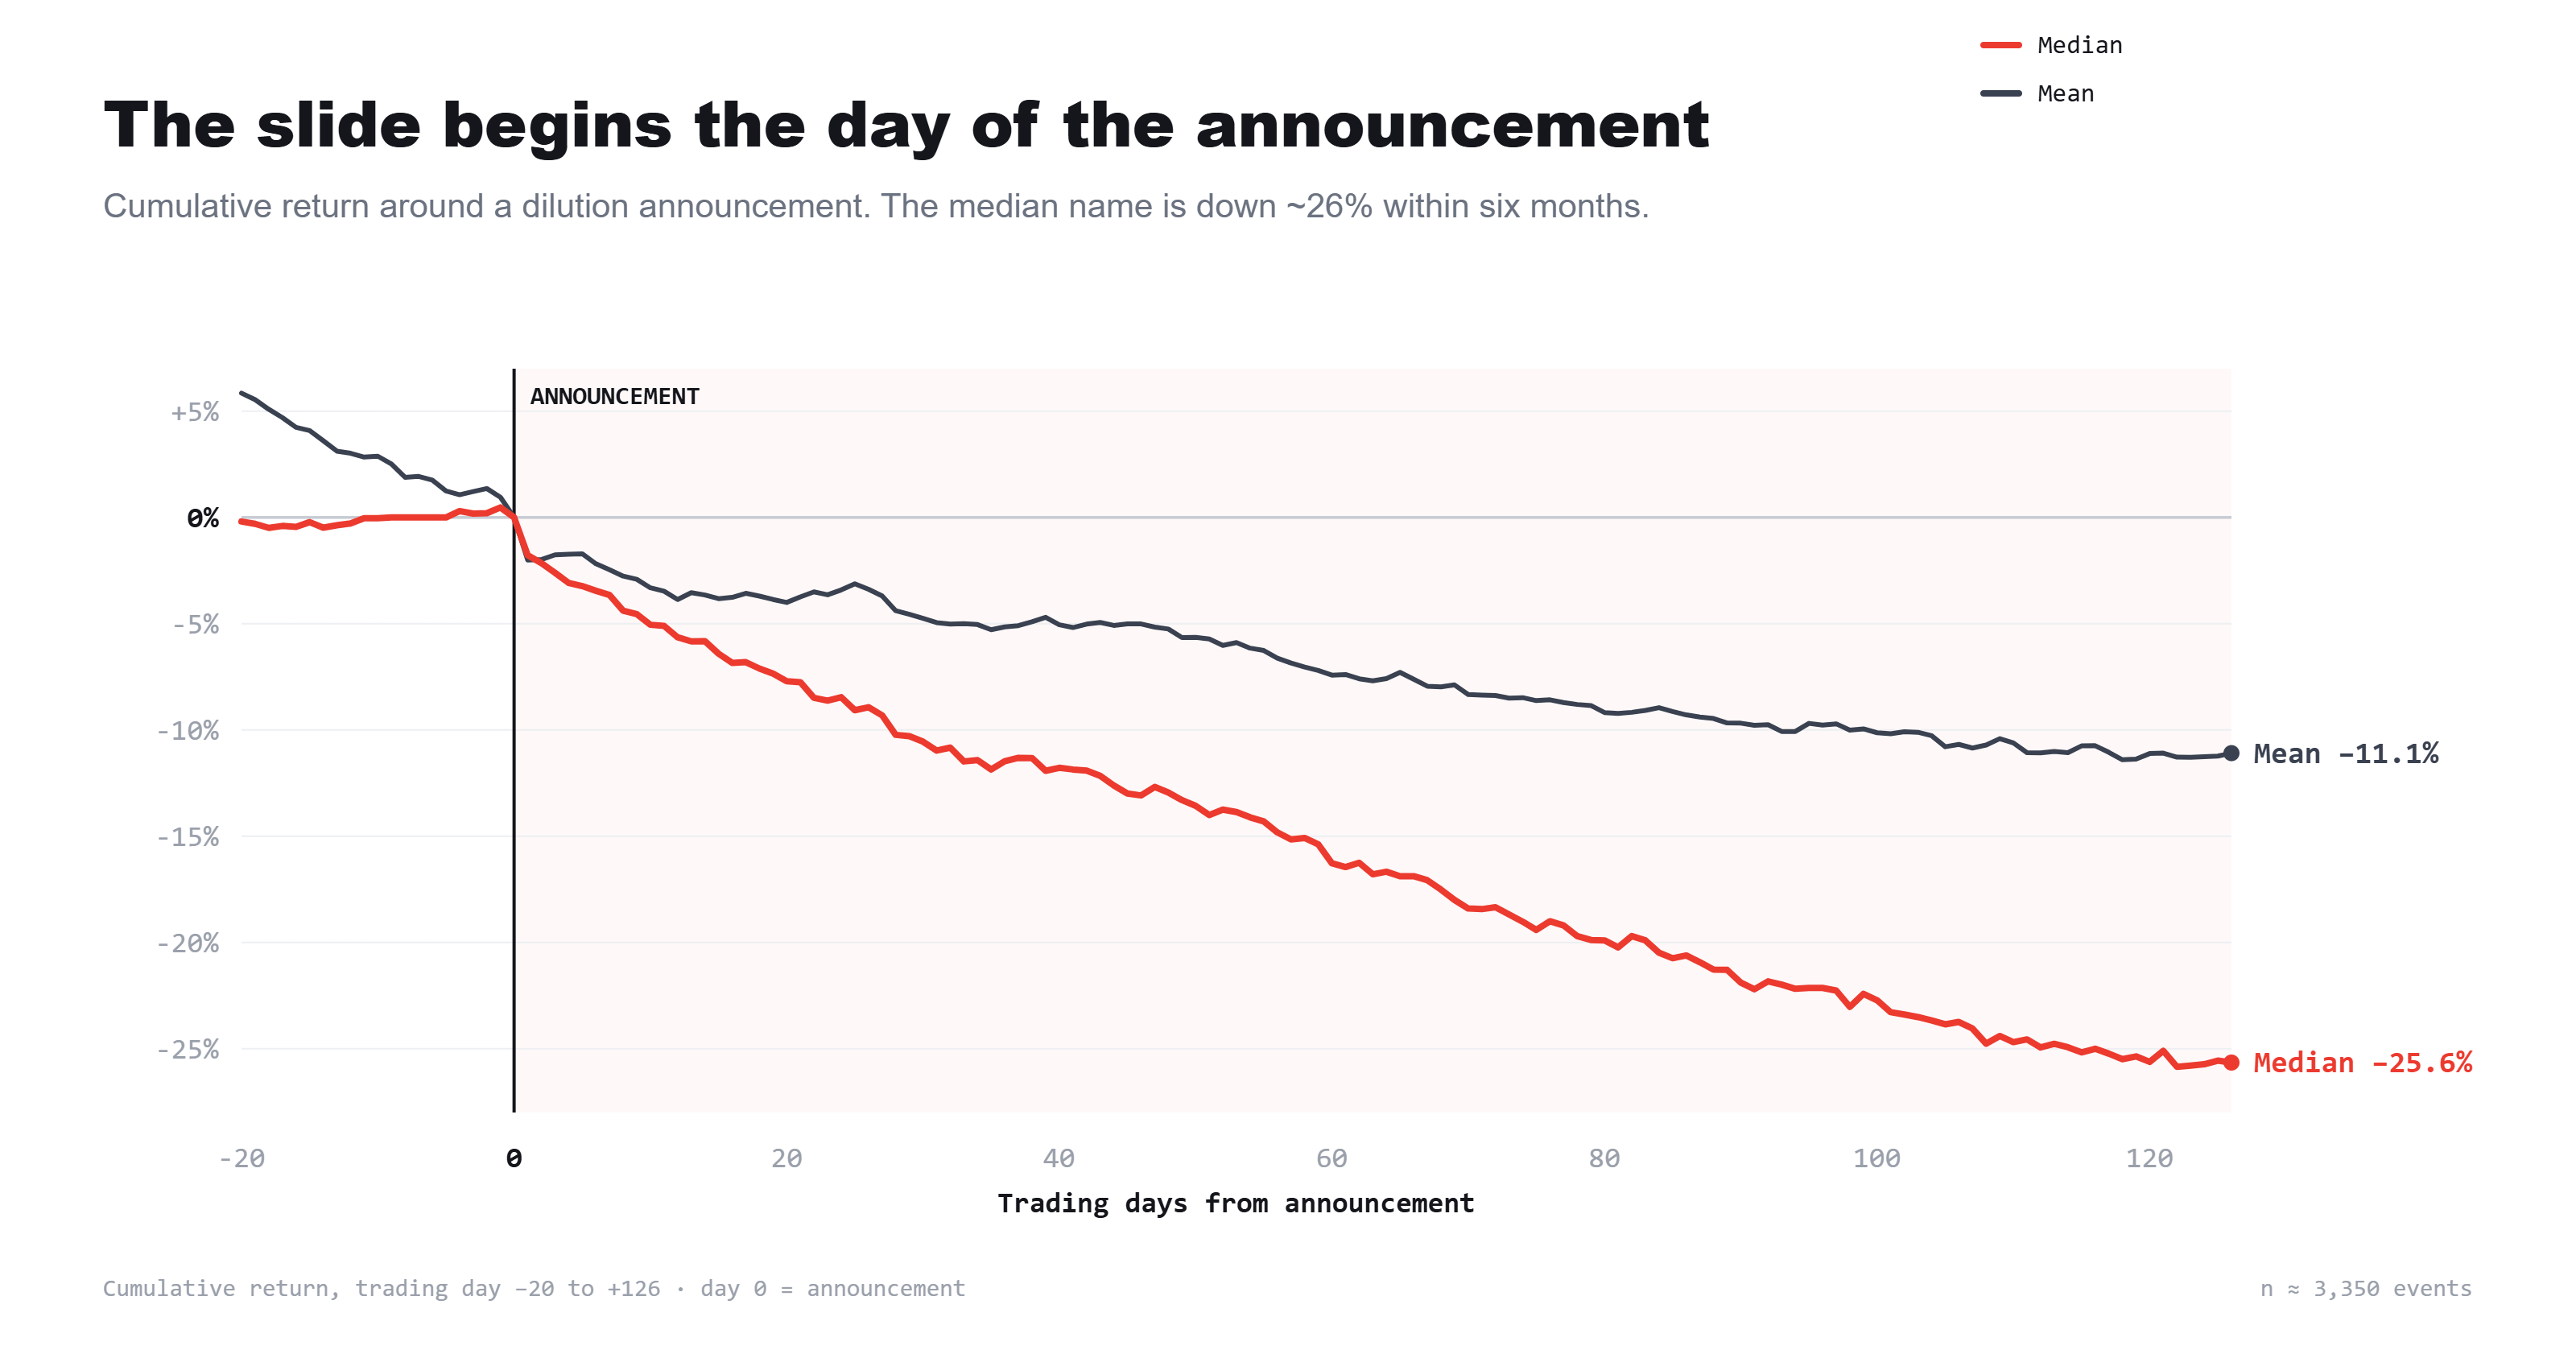
I also included the 20-day period prior to the dilution event to show how non-perfect timing might work. If every dilution event looked like it was preceded by a Gamestop short squeeze, then it wouldn’t be very useful. Luckily, it seems that performance doesn’t typically runup immediately preceding a dilution event.
Performance Distribution
Figure 7 shows the typical performance for diluters, but it’s worth considering the shape of the distribution.
Figure 8 uses the full dataset (going back to 2016), and illustrates the distribution of returns following a dilution event. Note that because we don’t have the filing dates, I made some assumptions on “entry date” based on the timing figures above - I used q_end + 45 days as the entry and a 6 month hold period from that date.
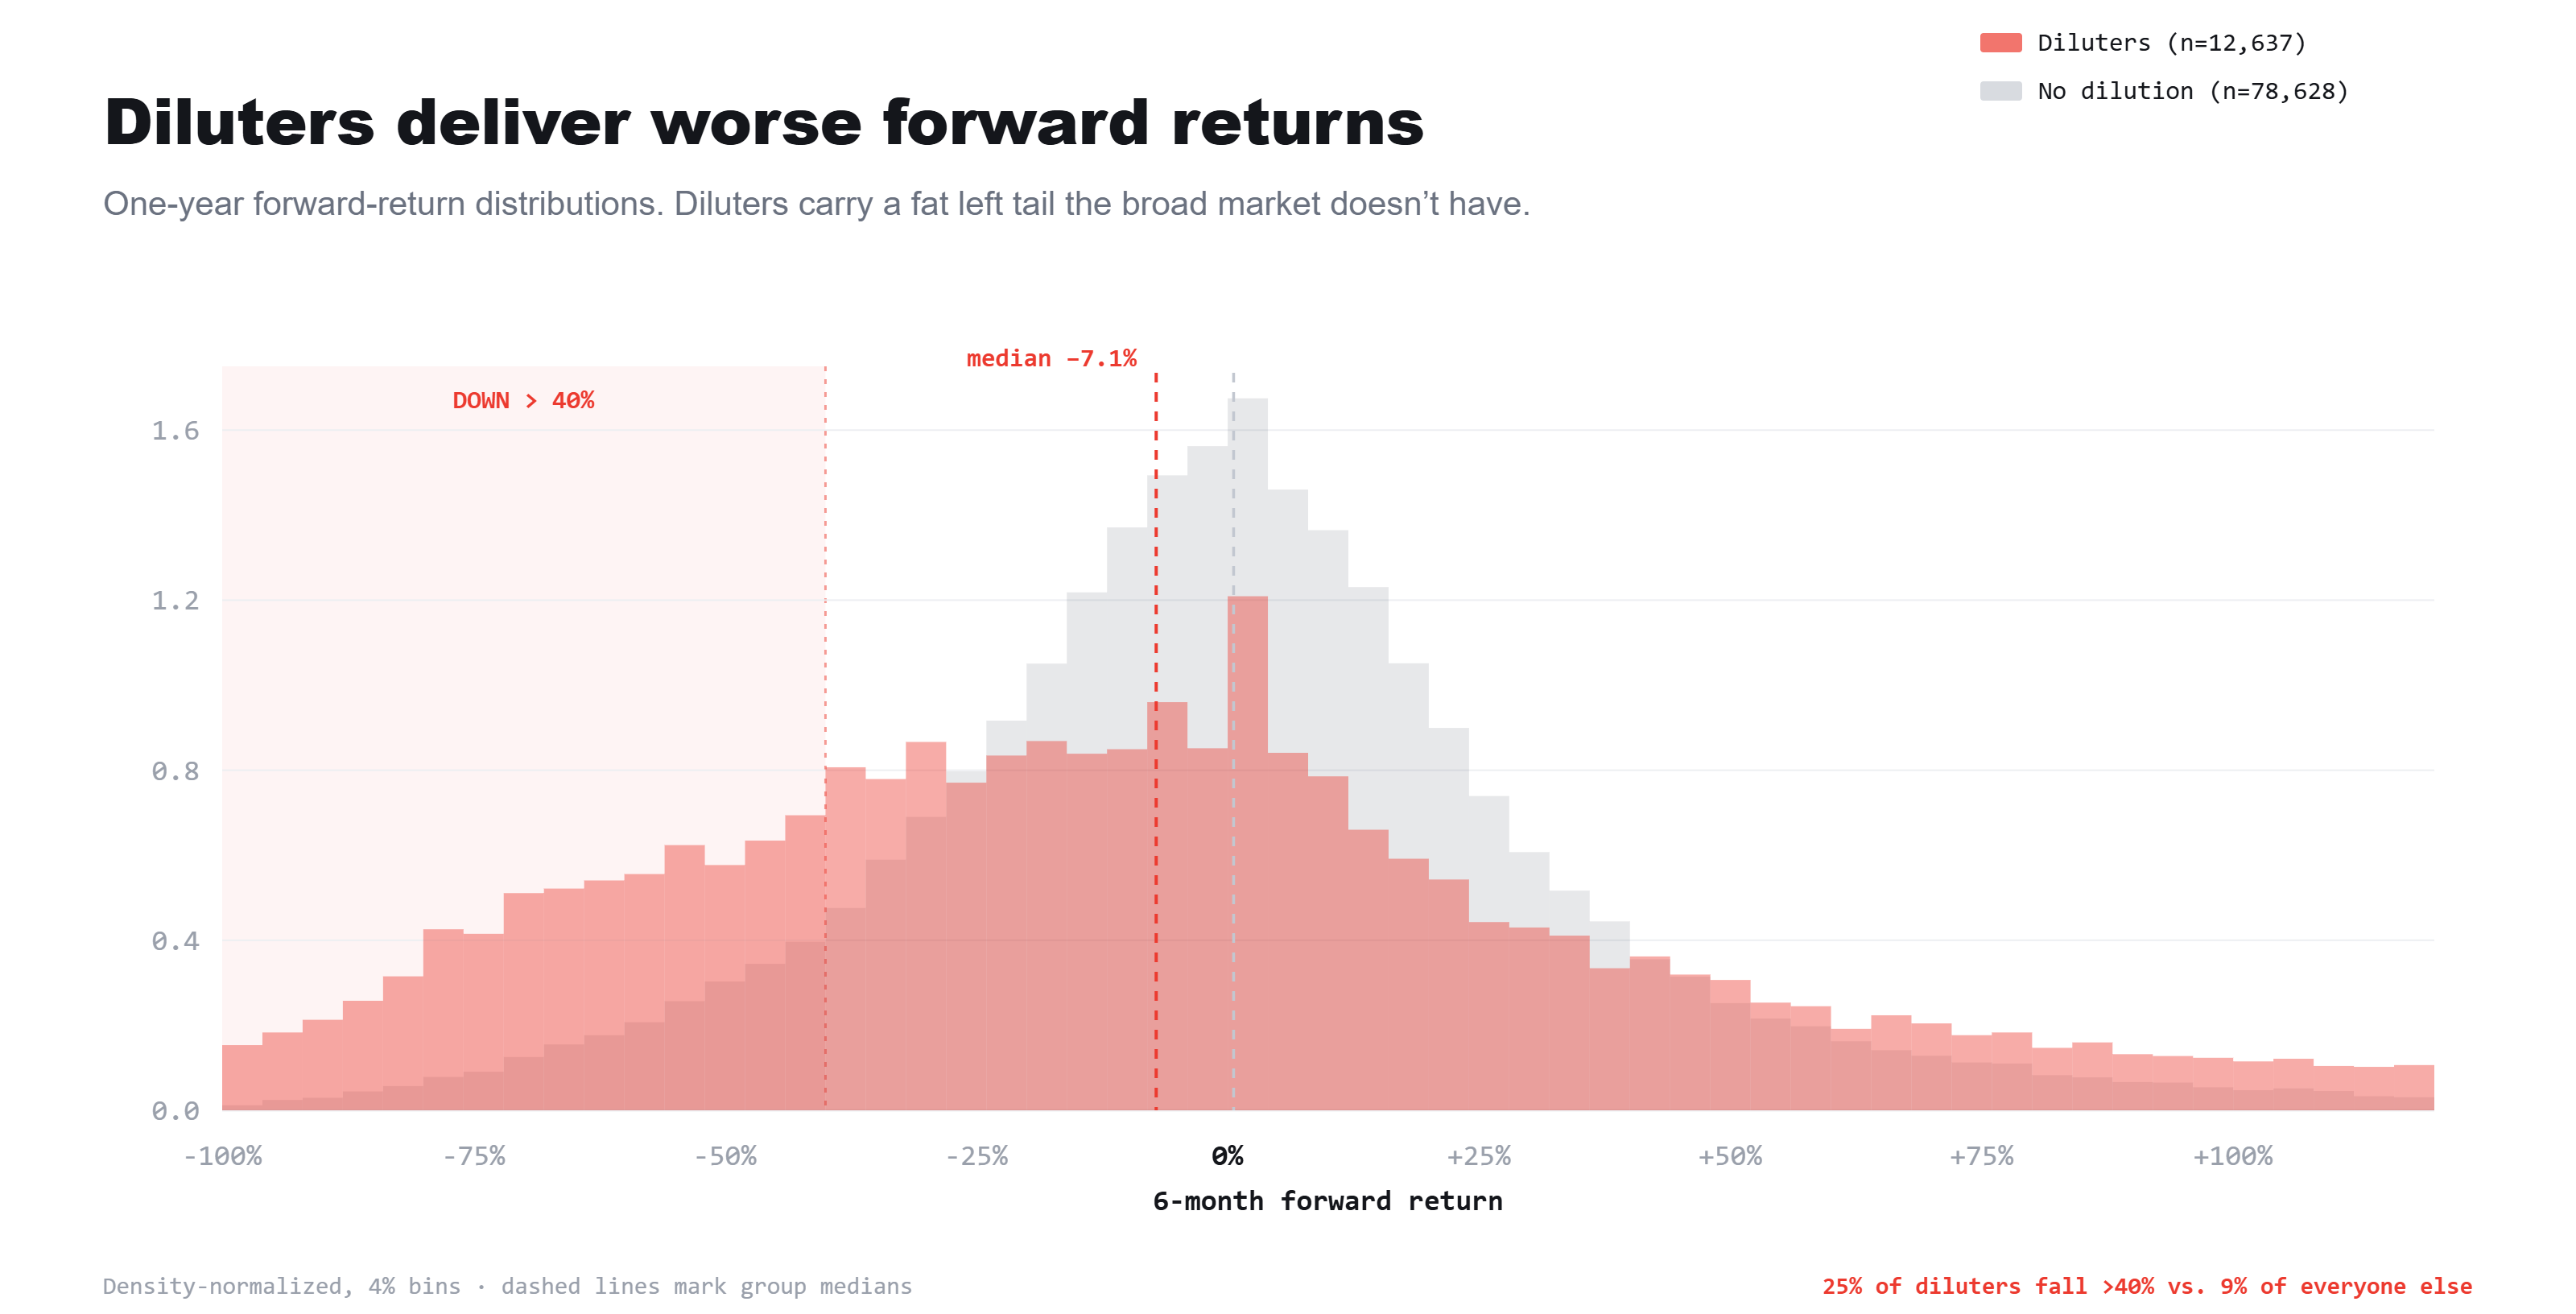
While the median return is -7% for diluters, a quarter of those companies fall by more than 40% in the following 6 months.
It is notable that the median return for the 2016-to-present data is considerably less weak than the 2021-to-present data. I have a few ideas why that’s the case. First, in the 2021 sample, we know the exact dates of dilution. Second, at Q + 45 days, it’s likely that most of the 2016 and-on data starts after the dilution event has occurred and misses the initial drop following a dilution event. That might be something to consider if I decide to re-run the study in the future.
Summary & Caveats
I think this was a very informative and productive first pass. After running the initial screen, it was gratifying to see that many companies with high dilution scores had already diluted leading into Q3.
SPCE 0.00%↑ , AMC 0.00%↑ , HTZ 0.00%↑ , LUNR 0.00%↑ , CRWV 0.00%↑
All of these had dilution probabilities between 30-60% using the Q1 2026 financial data, all diluted in June, and they’re all down double digits since then (LUNR & HTZ are down >60%).
That said, there are a bunch of caveats that are attached to this study as it’s currently performed, and I think there’s a good bit of work that needs to be done before this can become truly actionable as a trading strategy.
One big caveat is that the performance data is largely driven by a lot of junky companies. In fact, running the first screen returns a ton of companies with market caps below $50 million. The return profile for a micro cap, junky stock is probably much different than a company like Google, who recently went to the equity markets and their stock barely budged. We can’t apply the same performance expectations to Google that you would apply to a penny stock.
If we want to do a proper study on returns, we’ll need to correct for company size, sector, and likely other factors.
In addition, building out a short strategy probably won’t be very straight forward. For most of the small cap companies, options premiums already price in a ton of implied volatility. Looking qualitatively at some of the stocks that were flagged in my first screen, it doesn’t seem like there’s going to be a ton of alpha to be captured as their junky-ness and dilution risks are largely priced in.
That said, predicting the actual dilution event is broadly universal. The need for capital is a cash flow and balance sheet phenomena, and isn’t unique to any single cohort. I think this study tackles that aspect very well.