

Joby Unit Economics: Energy Consumption
eVTOL Physics Lesson

One component of the unit economics equation for air taxi services is the subject of “fuel consumption”. To get this portion of operating costs, we need to know how much energy is consumed for a particular mission and the cost of that energy.
For the S4, we generally know the battery capacity (160 kWh1) and the vehicle range (150 miles including reserves), so we can pretty quickly estimate the electricity costs per mile.
In New York City, for instance, electricity prices hover around 20 cents per kwh. That works out to about $32 for a full “tank”, and about 21.3 cents per mile.
But.
Not all flights are created equal. Or maybe a better way to put it, all flights are more equal than you’d think.
In fact, every flight will have two hover, two transition, and a climb segment…which are some of the most energy intensive parts of the flight. Cruise is actually pretty easy in terms of power consumption.
So while we might estimate that a 10 mile hop will use half the energy of a 20 mile flight, that probably won’t be the case.
In today’s article, I’m going to take a closer look at Joby’s energy consumption. This will serve a few purposes:
It’ll serve as a sanity check for Joby’s claims on range and payload.
It’ll be an important input for our unit economics calculation.
We can better estimate the unit economics based on location and route.
We can see what Joby’s advantage is (or if they have one) over competitors with heavier empty weight and differing aircraft configurations.
Flight Segments
The breakdown of the flight segments when flying a typical air taxi mission can be found in Figure 1.
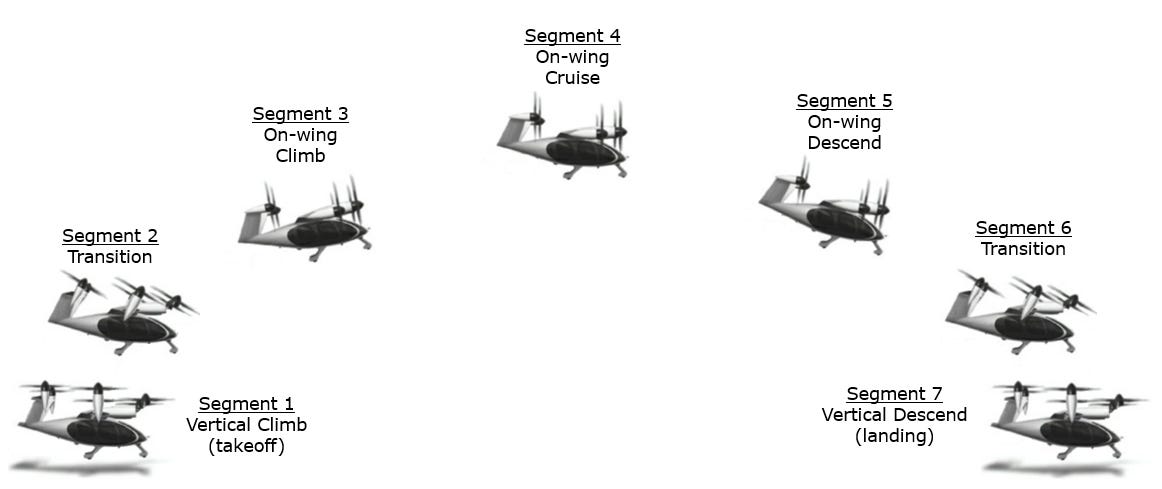
The following sections will go through each segment, and hopefully, the end result is a way to calculate the power and energy during operations.
Note, aircraft propulsion is outside the scope of my expertise - I had to brush off some old textbooks for this one. My hope is that we can get pretty close, and I think we should know by then end just how “in the ballpark” the energy usage is. If I come out with less than 50 kwh or greater than 200 kwh of energy usage for a 100 mile trip, we can pretty safely assume that I’ve made a mistake somewhere…or the Joby team has made a misstep somewhere on their end…yeah, probably that
Also, this isn’t meant to be a rigorous study. I make approximations liberally. Hopefully they’re with good basis. If you have any suggestions on improvements to this analysis or find any errors, please feel free to chime in in the comments!
Let’s jump right in.
Power & Energy Consumption
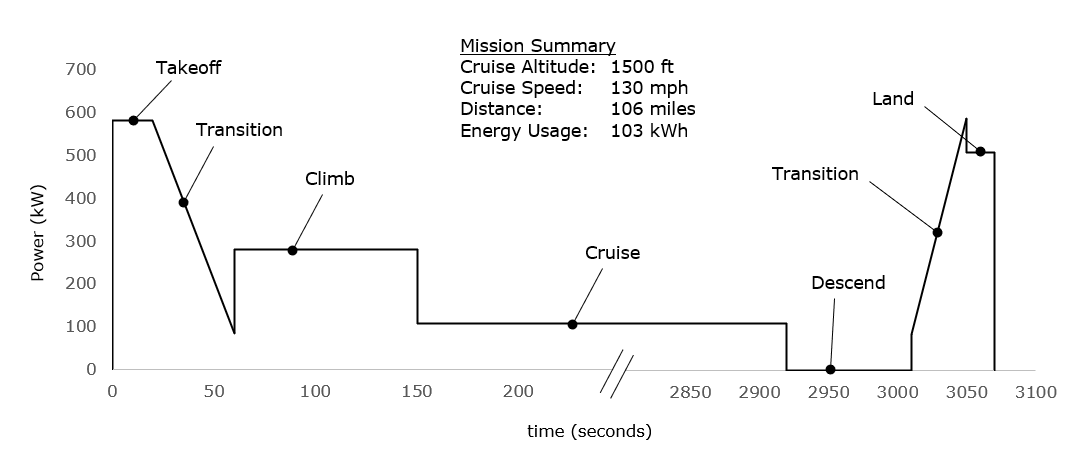
Power usage can be estimated by common equations used for helicopter and propeller propulsion systems. The power profile for each segment can be seen in Figure 2. This highest power segments are takeoff, landing, and near the hover phases of transition. Cruise and descent will be the lowest power draws of the flight.
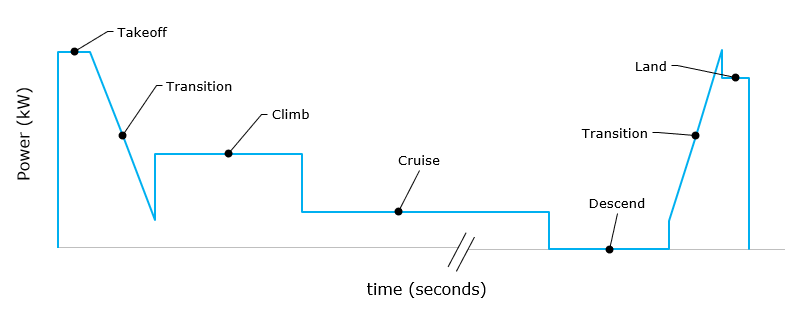
We can find total energy consumption by calculating the area under the power curve in Figure 2.
We’ll have to make some estimates on what each segment looks like. A good starting place is qualitatively looking at some of the flights Joby has publicly released. Here’s a recent post from Joby that I’ll base some of my estimations on.
In this video, we can estimate the time for first 3 segments of the mission:
Takeoff - 20 seconds
Transition - 40 seconds
Climb (5 degree climb rate) - 90 seconds
Summary
I parse through each phase of the flight in the following sections, calculating the power profile and energy usage. I’ll quickly summarize the findings here.
In general, Joby’s claims do seem to hold water. I found that the S4 can operate at full payload (1,000 lbs) with a range of 100 miles, while still retaining 20+% battery capacity for reserves (assuming a 160 kWh battery pack).
Figure 3 shows the energy consumption and travel time by range. In addition, 2 speeds were cataloged:
max endurance (130 mph)
max speed (200 mph)
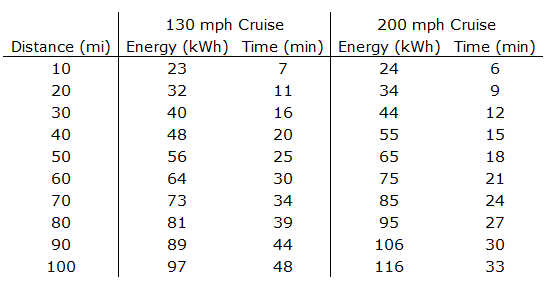
In order to calculate energy costs, you can simply multiply the energy usage (in kWh) by the energy prices in ($ / kWh) for the region of operation. For instance, the Manhattan to JFK flight is just above 10 miles. From Figure 3, and operating at 130 mph, the energy usage will be about 25 kWh. At $0.25 per kWh, that yields a total trip cost of around $6 in electricity costs.
This represents a very small part of the total projected ticket costs. I’ll be going through all of the individual components of operational costs to be sure to follow along.
Segment 1: Vertical Climb (takeoff)
From the video, the takeoff segment seems to take roughly 15 to 20 seconds from engine spool-up through climb and into transition. It seems that they climb to between 50 and 100 feet off the ground.
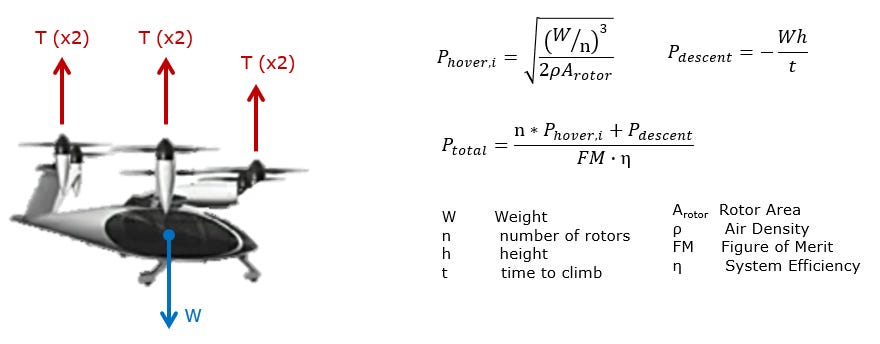
Power consumption in hover is driven by common helicopter physics (Source - equation 8).
For a little background on Figure of Merit (as defined in the source), see the following excerpt:
Figure of merit is a useful metric to evaluate the hover efficiency of a rotor. It’s defined as the ratio of ideal power…to the actual power consumed in hover. Hence, a rotor with a figure of merit (FM) of 1 would be “perfectly efficient.” Real rotors, with a finite number of blades, nonuniform inflow, tip losses, drag, etc., typically have FM below 0.8.
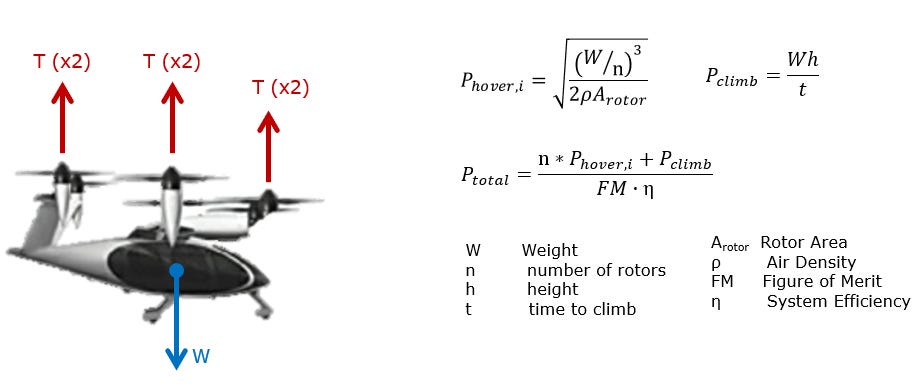
Before calculating the numbers we can see the drivers of power for segment 1.
More weight (in the numerator) means more required power (and thus, energy consumption).
Larger diameter rotors leads to less required power and energy consumption.
Running the numbers…
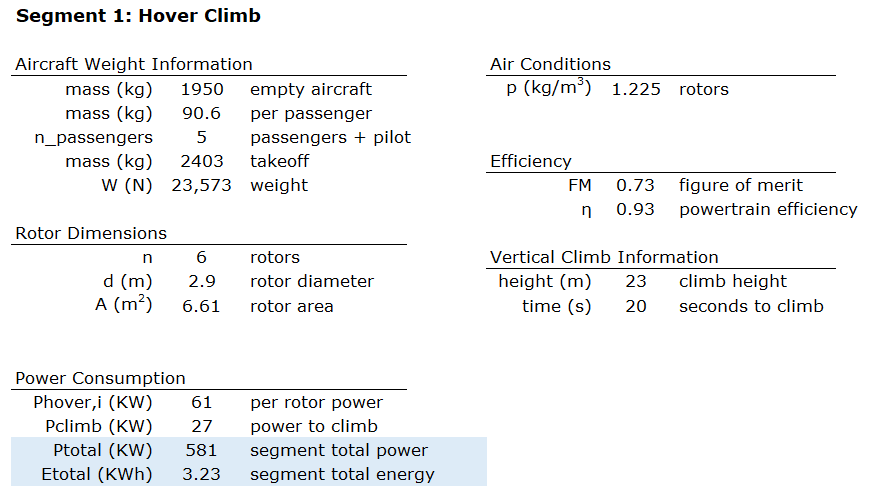
We see that 581 kW max power is needed to perform segment 1. Being that power consumption is high, it makes sense that Joby tries to get “on-wing” as fast as possible.
3.23 kWh is actually much lower than I would have initially suspected. But again, the energy usage is a result of keeping the segment length to 20 seconds.
To frame it in a different way, the energy usage in this segment is 1 kWh for every six seconds. So Joby could essentially hover for 16 minutes before draining the full 160 kWh battery pack.
Segment Length: 20 seconds
Peak Power: 581 kW
Average Power: 581 kW
Energy Consumed: 3.2 kWh
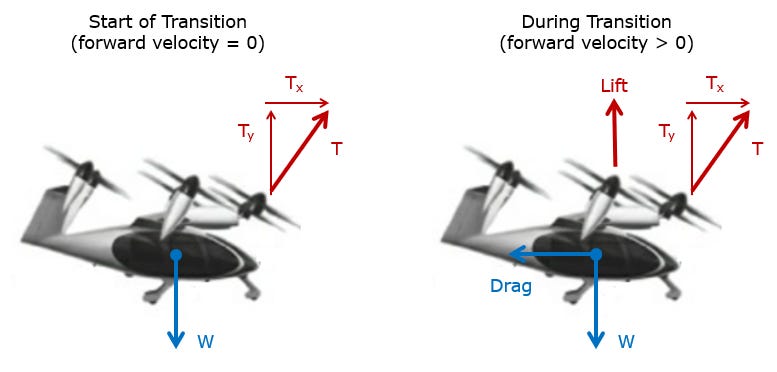
Segment 2: Transition
Segment 2 is a tricky one. At the start of transition, there’s no forward velocity of the craft so there is no drag and no lift. To get the aircraft moving, total thrust has to be higher than the weight of the craft because a portion of it needs to go towards pushing the aircraft forward (left image in Figure 6).
As the craft speeds up, the wing starts to help offset the weight (right image in Figure 6), and the engines can begin to spool down.
Now, we could go through the entire exercise of trying to calculate the power at each time interval as the aircraft speeds up, incrementally changing the thrust vector and calculating the lift, drag, and thrust profile. But, we know that the power needed at initial transition will be about the same as in segment 1, and the power at the end of transition will be similar to level cruise at around 100 mph (cruise data can be found in Figure 12). We don’t know the exact path of the power curve, but a linear approximation should get us in the ballpark. That’s what’s shown in Figure 7.
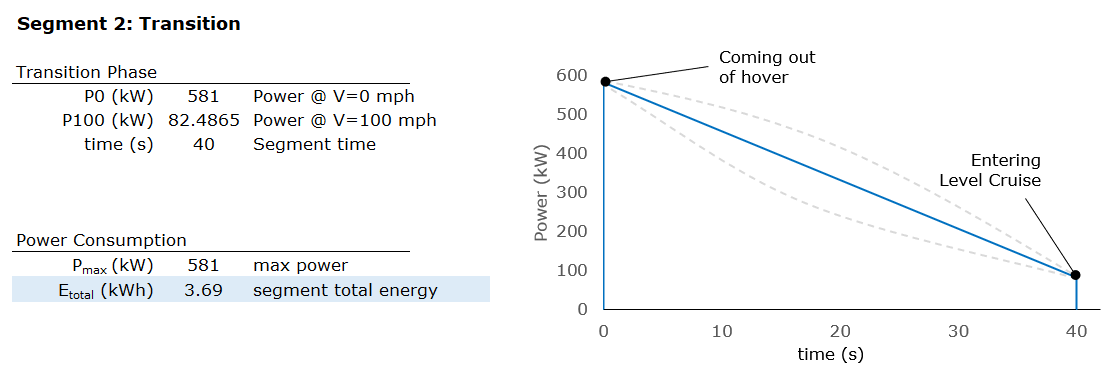
Segment Length: 40 seconds
Peak Power: 581 kW
Exit Power: 82 kW
Energy Consumed: 3.7 kWh
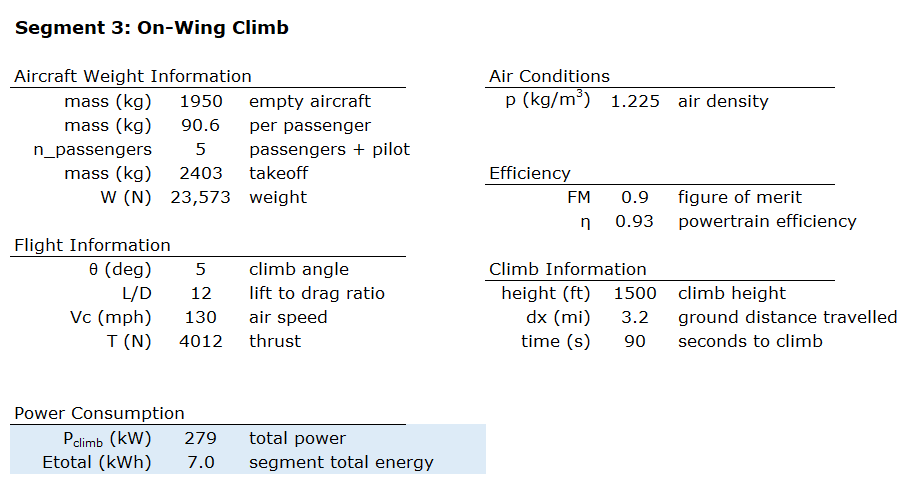
Segment 3: Climb
The third segment is climbing up to cruising altitude. On-wing climb is similar to level cruise (Segment 4) except that thrust in this segment will work against gravity.
In the video linked above, the stated angle of climb is about 5 degrees.
We actually have an interesting checkpoint to reference against at this stage. In the video linked above, Buddy Denham states that the battery pack is at 91% state of charge (timestamp: 2:48).
To this point, the calculations bear out that vertical climb, transition, and on-wing climb have used 14 kWh (3.2 + 3.7 + 7.0), which implies just over 91% state of charge (for a 160 kWh pack). So that is pretty encouraging.
My calculation assumes a full payload with a pilot + 4 passengers, so I may be slightly unconservative, here, since this test flight only had a pilot (plus some test equipment, probably).
Exit Altitude: 1500 ft.
Segment Length: 90 seconds
Power: 241 kW
Energy Consumed: 7.0 kWh
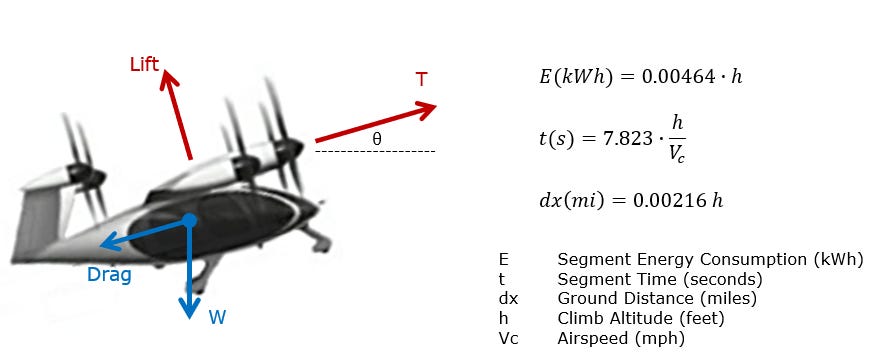
Segment 3 Mission Variables & Shorthand
Mission parameters will affect total energy usage for a given trip. For instance, if the aircraft climbs to 2500 ft. (instead of 1500 ft.), the total energy consumption for this segment would obviously be much higher. In addition, the ground distance travelled will change as well, which is important for the overall trip length. In the scenario laid out in Figure 9, the aircraft will travel 3.2 miles during the climb segment. That obviously counts against the total trip length. If Manhattan to JFK is 12 miles, and climb & descent account for 6 miles in total, then cruise will only be 6 miles.
In order to be able to quickly calculate the segment details, I’ve provided some shorthand calculations, here:
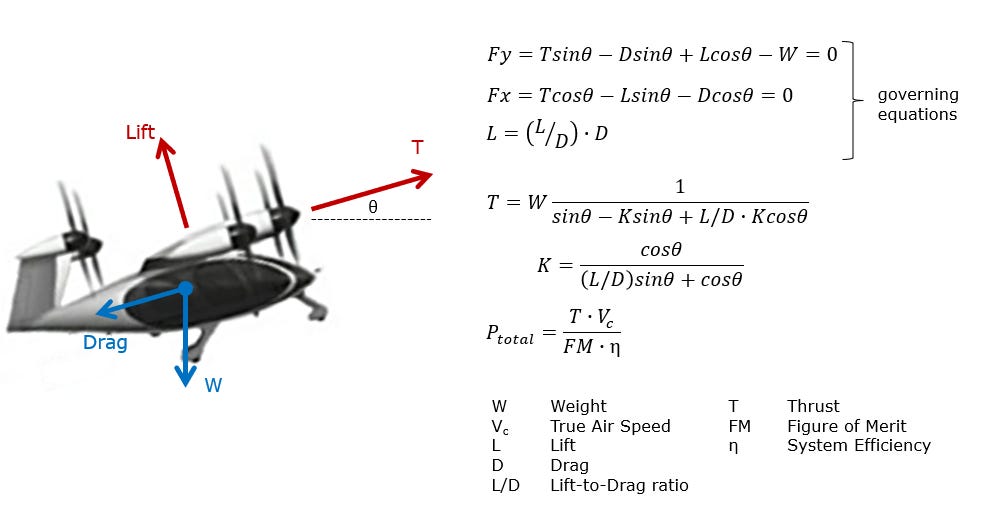
Segment 4: Level Cruise
In the previous segments, the rotors are at least partially directly “fighting” gravity - i.e., the props are doing the work to keep the aircraft in the air. For level cruise, the wings are doing that work. The props’ job in this segment is to keep the aircraft moving forward, primarily fighting drag.
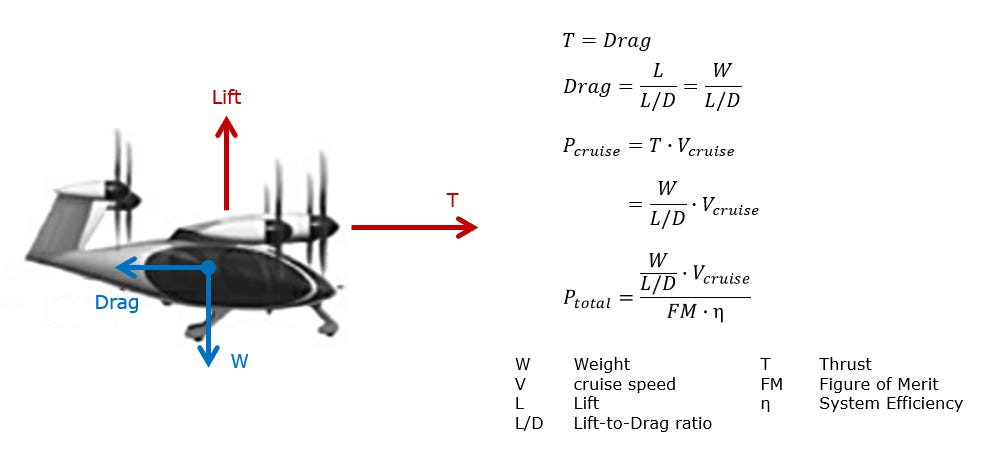
Looking qualitatively at these relationships, we see that, again, power is proportional to weight. In addition, a higher lift to drag ratio (L/D) and higher cruise speed decrease and increase power requirements, respectively.
Also note that L/D will be dependent on cruise speed23. I present power consumption and energy usage for multiple different cruise speeds in the bottom right pane in Figure 12.
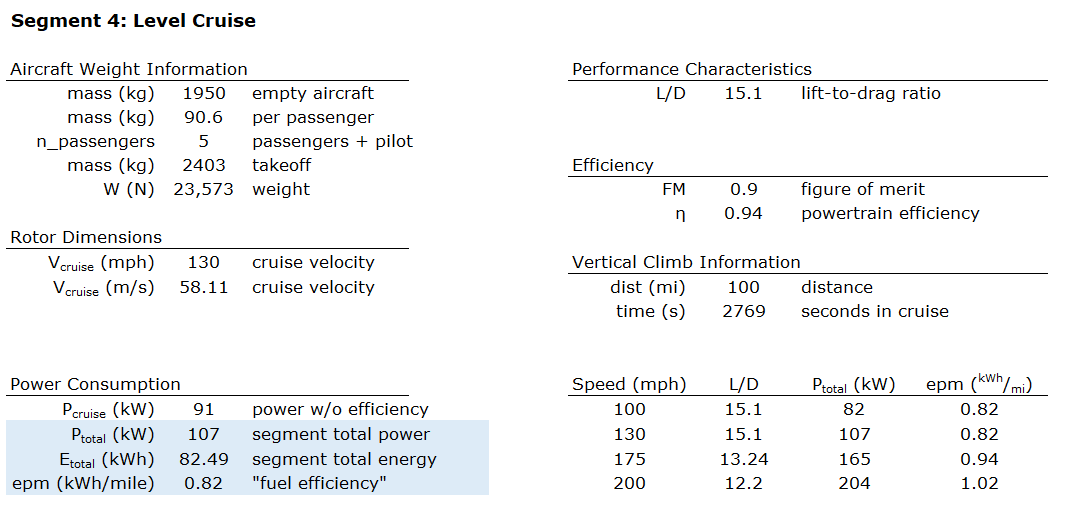
The bottom right panel shows the energy usage per mile of flight for different air speeds. As you increase air speed, the aircraft becomes less efficient from a fuel perspective. I’ll present the 130 mph (max endurance) cruise speed metrics below.
Segment Length: variable
Peak Power: 107 kW (@ 130 mph)
Energy Consumption Rate: 0.82 kWh per mile (@ 130 mph)
Energy Consumed (@ 130 mph, 100 miles): 82 kWh
Segment 5: Descent
This segment will be very similar to Segment 3 - the climb phase - only in this case, gravity will be working with the direction of the aircraft and the change in potential energy will be negative. So we should expect to see energy usage to be considerably lower than in Segment 3.
We can actually reuse the methodology from Segment 3, only changing the climb angle to -5 degrees (descent).
Interestingly enough, the power requirement for descent rounds to zero as the aircraft’s weight helps turn potential energy into forward motion.
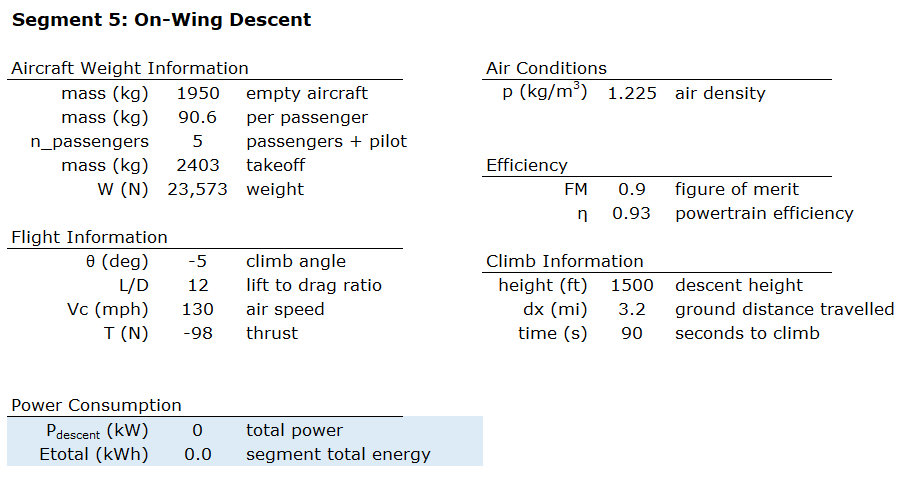
Segment Length: 90 seconds
Power: 0 kW
Energy Consumed: 0 kWh
Segment 6: Transition to Hover
Segment 6 is the mirror opposite of Segment 2. Here, the aircraft will start out in (essentially) a level cruise, and transition to hover.
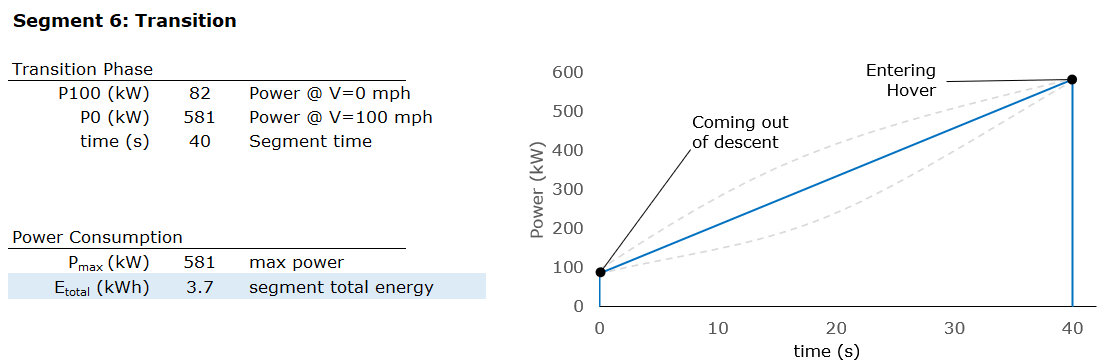
Segment Length: 40 seconds
Peak Power: 581 kW
Energy Consumed: 3.7 kWh
Segment 7: Vertical Landing
This segment is a mirror of Segment 1 (vertical climb). The power required for landing will be less than that of climb because the change in potential energy is negative.
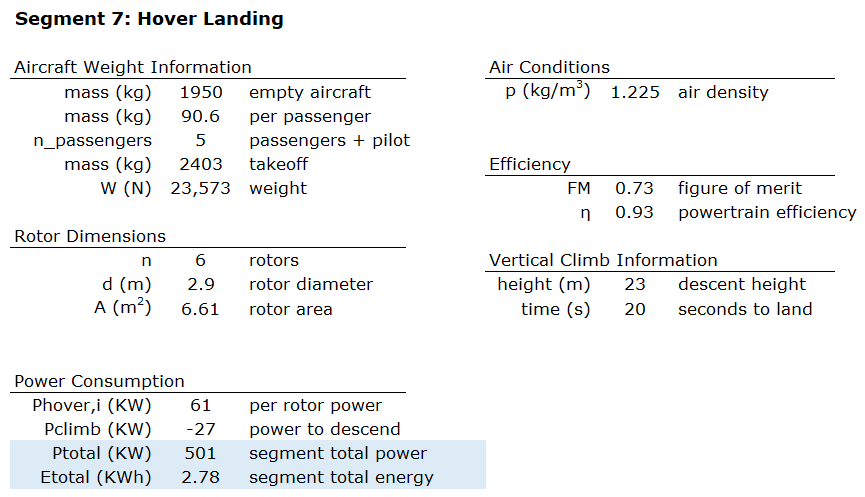
Segment Length: 20 seconds
Peak Power: 501 kW
Energy Consumed: 2.78 kWh
Flight Profile: Bringing It All Together
Here, I’ll present two missions: Max Endurance and Max Speed
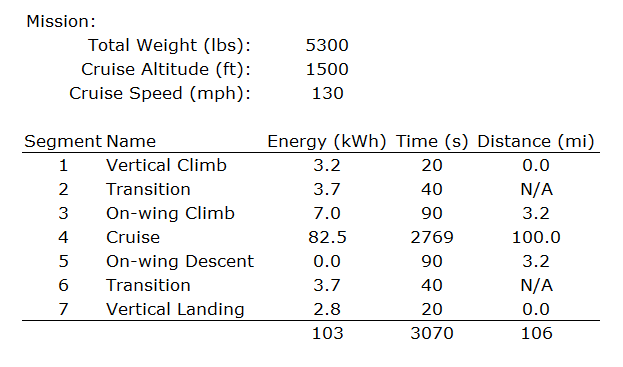
Max Endurance
We see here, that a 100 mile trip uses just over 103 kWh, which is 82% of the stated battery capacity of the aircraft. This passes the “smell test” and answers the question of “can this thing fly 100 miles with max payload?”
It’s also worth pointing out that the S4 has a stated range of 150 miles. I’m not able to show that to be the case. Using the maximum speed mission, a 150 mile total range is projected to use 167 kWh of energy, which only exceeds the S4’s capacity (160 kWh) by about 4%. This is within my expected margin of error.
Max Speed
Running this exercise makes it clear that there’s a pretty sizeable range penalty as flight speed increases - increasing flight velocity from 130 mph to 200 mph comes with a 20% reduction in range when using the same amount of energy.
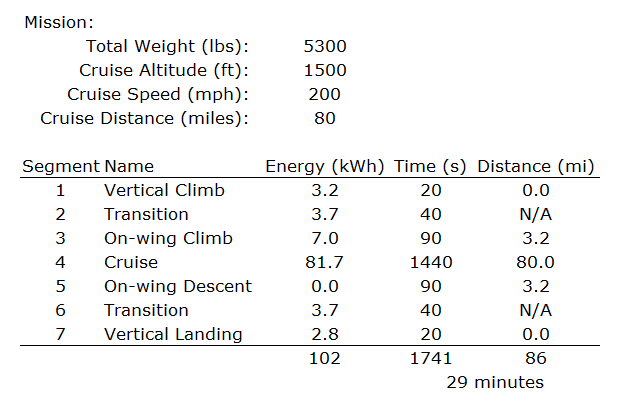
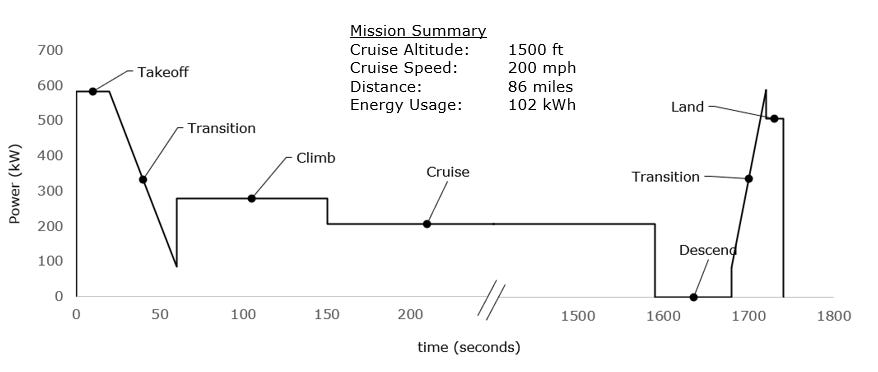
Note that only “Cruise” is affected in the power profile.
Unit Economics
This entire exercise was a build up to approximating the the cost of electricity per mission flown. We’d like to be able to make a reasonable guess for a particular route & distance.
We know that every flight will have a takeoff (3.2 kWh), transition to cruise (3.7 kWh), transition to hover (3.7 kWh), and landing (2.8 kWh) for a total of 13.4 kWh for the common segments for every mission. That leaves climb, cruise, and descent segments which will be variable and based on elevation gain and total distance of the mission. The resulting energy calculation is as follows:
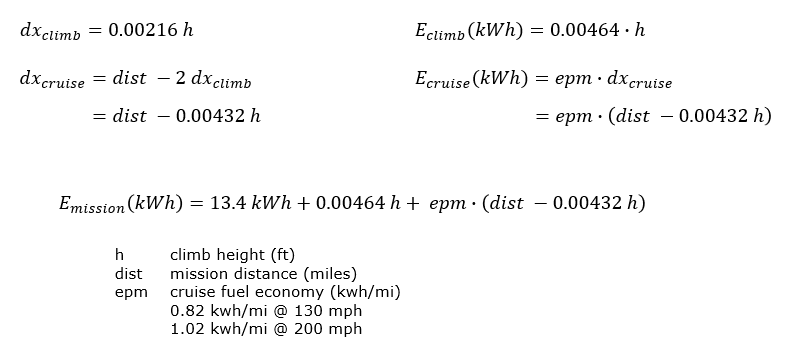
We can use this to get a quick, but detailed, estimate for energy usage for any particular mission.
For example, the flight from Manhattan to JFK is about 12 miles. If we use the same 1500 ft. climb and using 12 miles for the distance, we get 25 kWh of energy usage. This works out to about $6 in energy costs.
And of course, circling back to the example at the very beginning of the article, a trip that’s twice the distance (24 miles) will use 35 kWh - only 38% more energy used despite doubling the distance travelled.